Barley Harvest Annual Report 2022
Barley production in 2022
On this page:
Annual production statistics
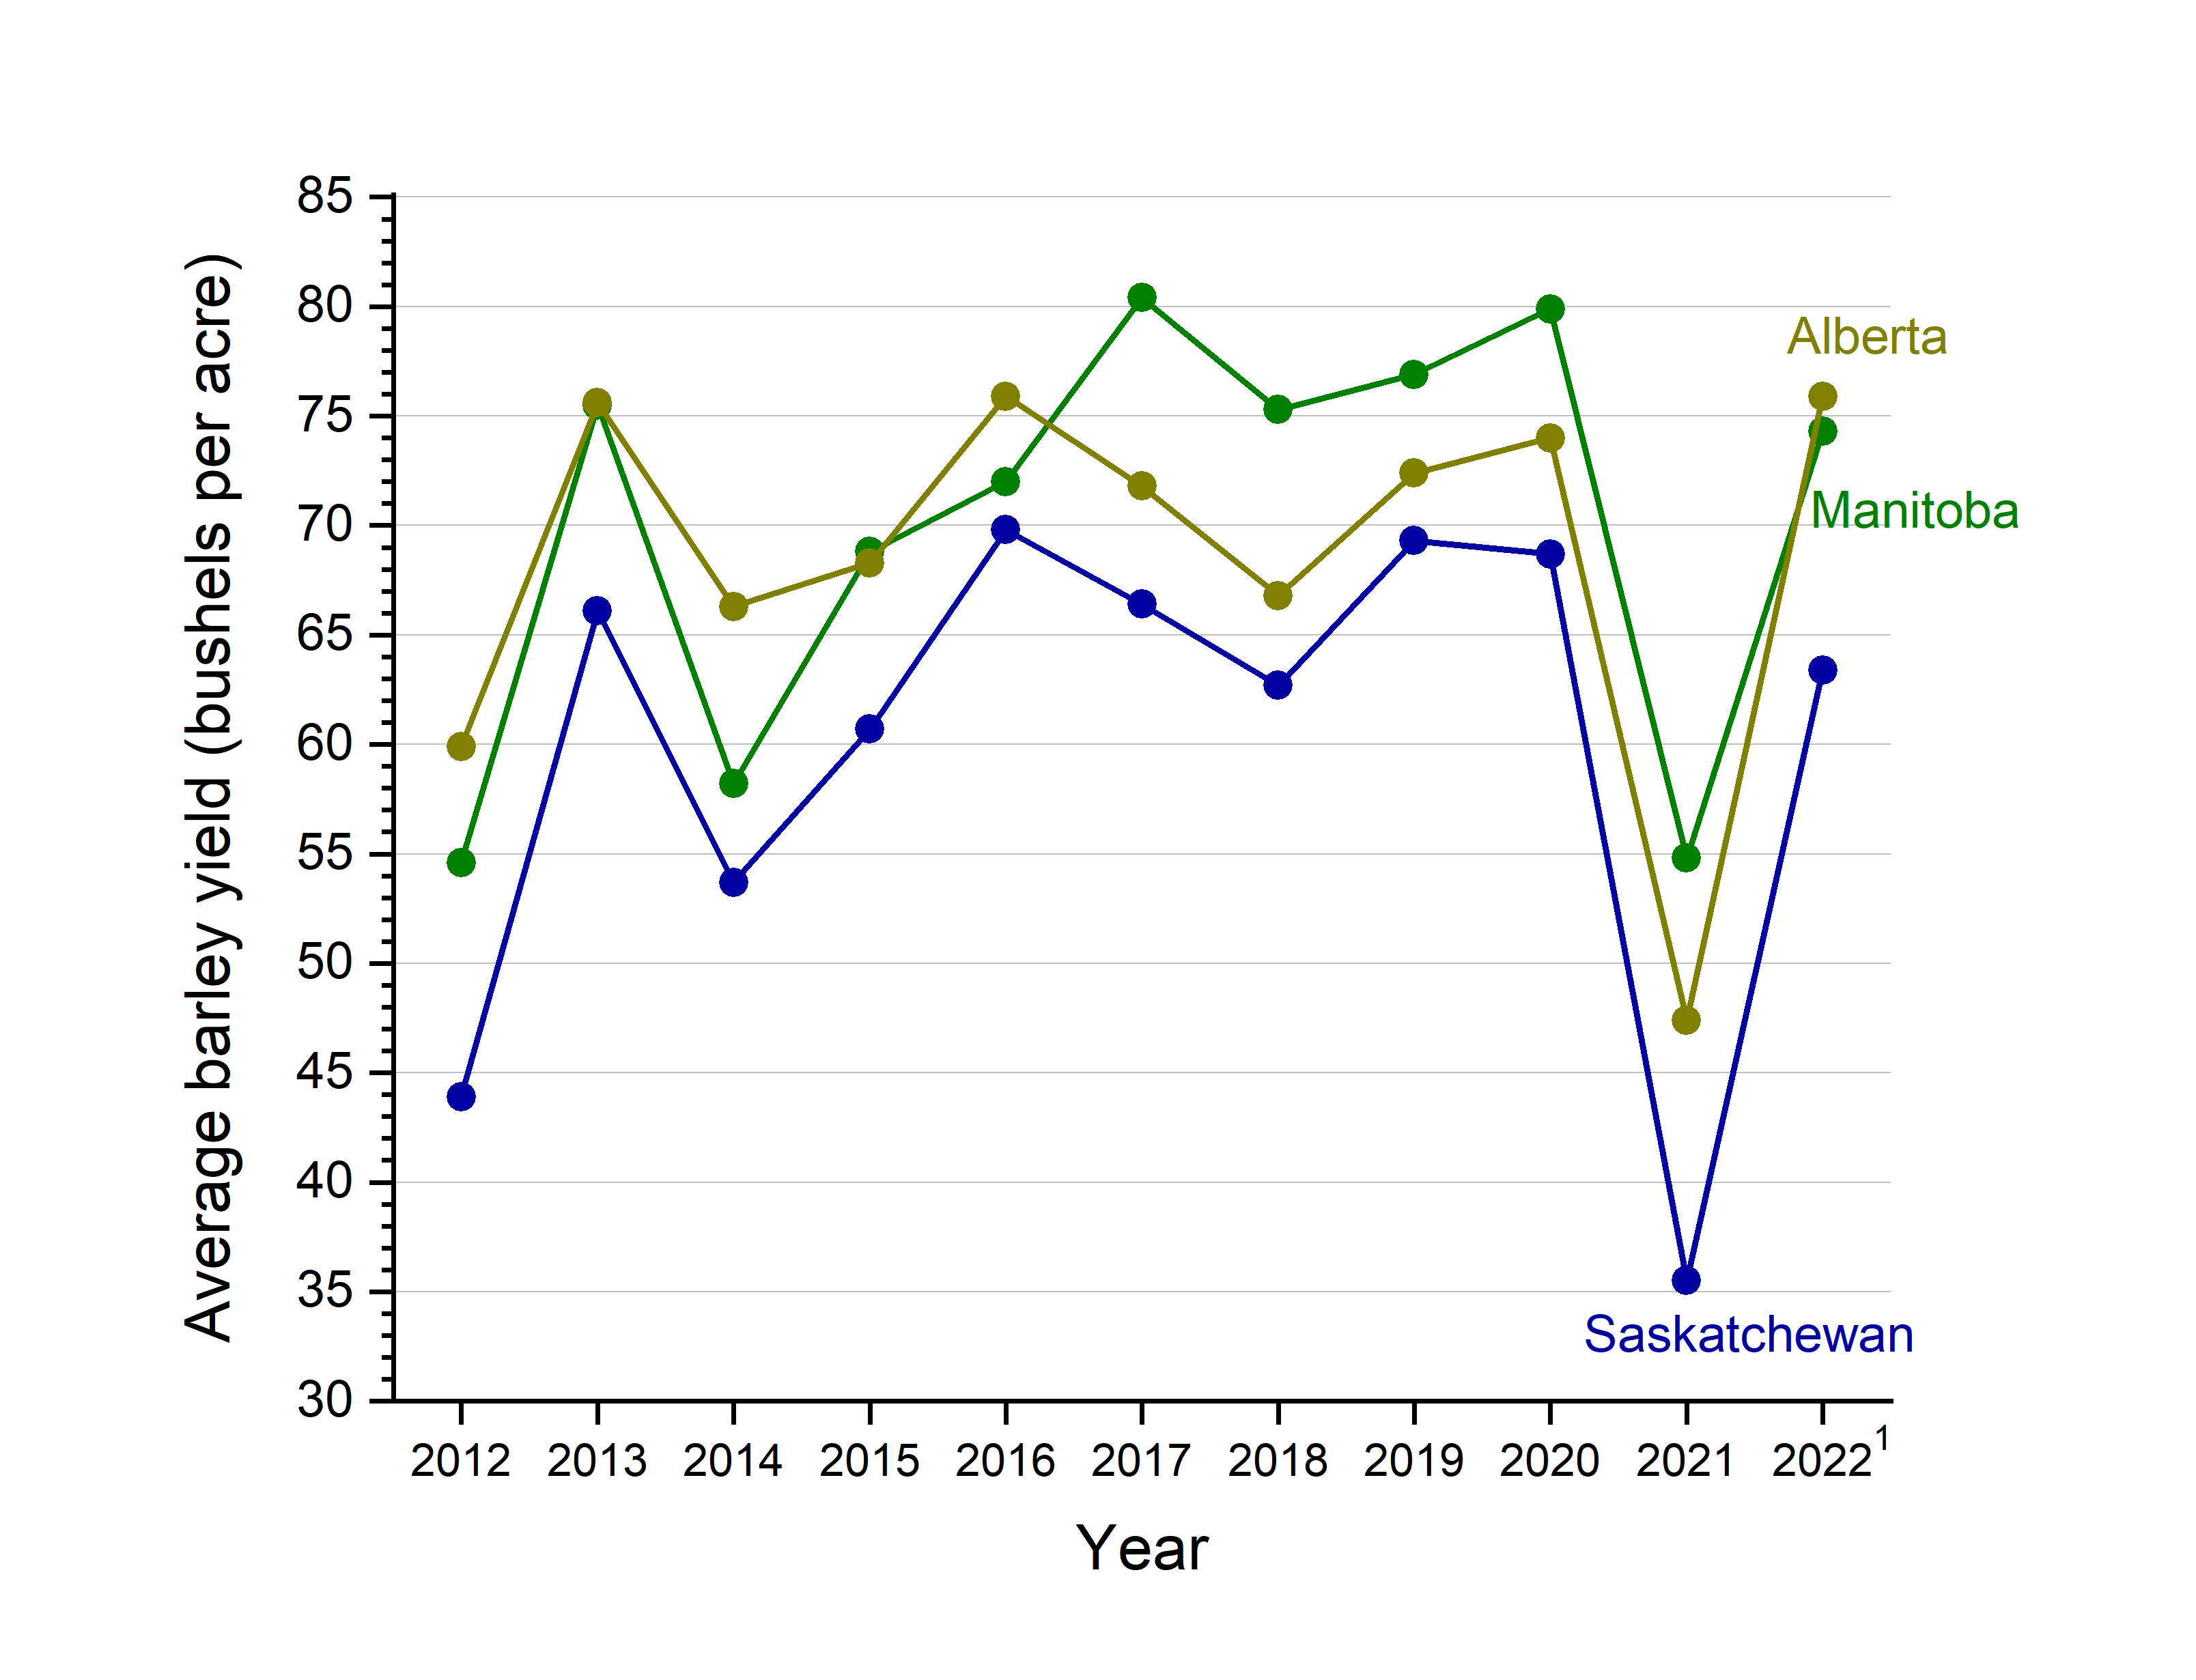
In 2022, the total area seeded with barley in western Canada was 2.761 million hectares. This is lower than last year (3.262 million hectares), but close to the 10-year average (2.684 million hectares) (Table 2.1). Barley production in western Canada in 2022 is estimated at 9.666 million tonnes. This is approximately 46% higher than last year and 17% higher than the 10-year average (Table 2.2). The favourable growing conditions in 2022 resulted in an estimated barley yield of 70.5 bushels per acre (BPA), higher than the 10-year average yield (64.7 BPA) (Table 2.3 and Figure 2.3).
Table 2.1 Area (million hectares) seeded with barley in Canada
Figure 2.1 Annual comparison of area (million hectares) seeded with barley in western Canada

Table 2.2 Barley production (million tonnes) in Canada
Figure 2.2 Annual comparison of barley production (million tonnes) in western Canada

Table 2.3 Average barley yield (bushels per acre) in Canada
Figure 2.3 Annual comparison of average barley yield (bushels per acre) in western Canada

Distribution of barley classes
Barley is grown across the Canadian prairies and is used for malting, food, and general purposes (feed and forage). Based on insured commercial acres in 2022, general purpose barley accounted for 53.2% of the area seeded with barley in Alberta and British Columbia while malting barley accounted for 42.7% (Figure 2.4a). In Saskatchewan, the majority of the area seeded with barley (56.2%) was planted with malting barley varieties (Figure 2.4a). In Manitoba, approximately 40.5% of the area seeded with barley was planted with malting varieties and 54.1% with general purpose varieties (Figure 2.4a). Across western Canada in 2022, the area seeded with barley consisted of 48.2% malting barley, 44.3% general purpose barley, and 2.4% food barley (Figure 2.4b).
Figure 2.4a Distribution of barley classes as a percentage of total area seeded with barley in each province in 2022Footnote3

Figure 2.4b Distribution of barley classes as a percentage of area seeded with barley in western Canada from 2017-2022Footnote3

Distribution of malting varieties
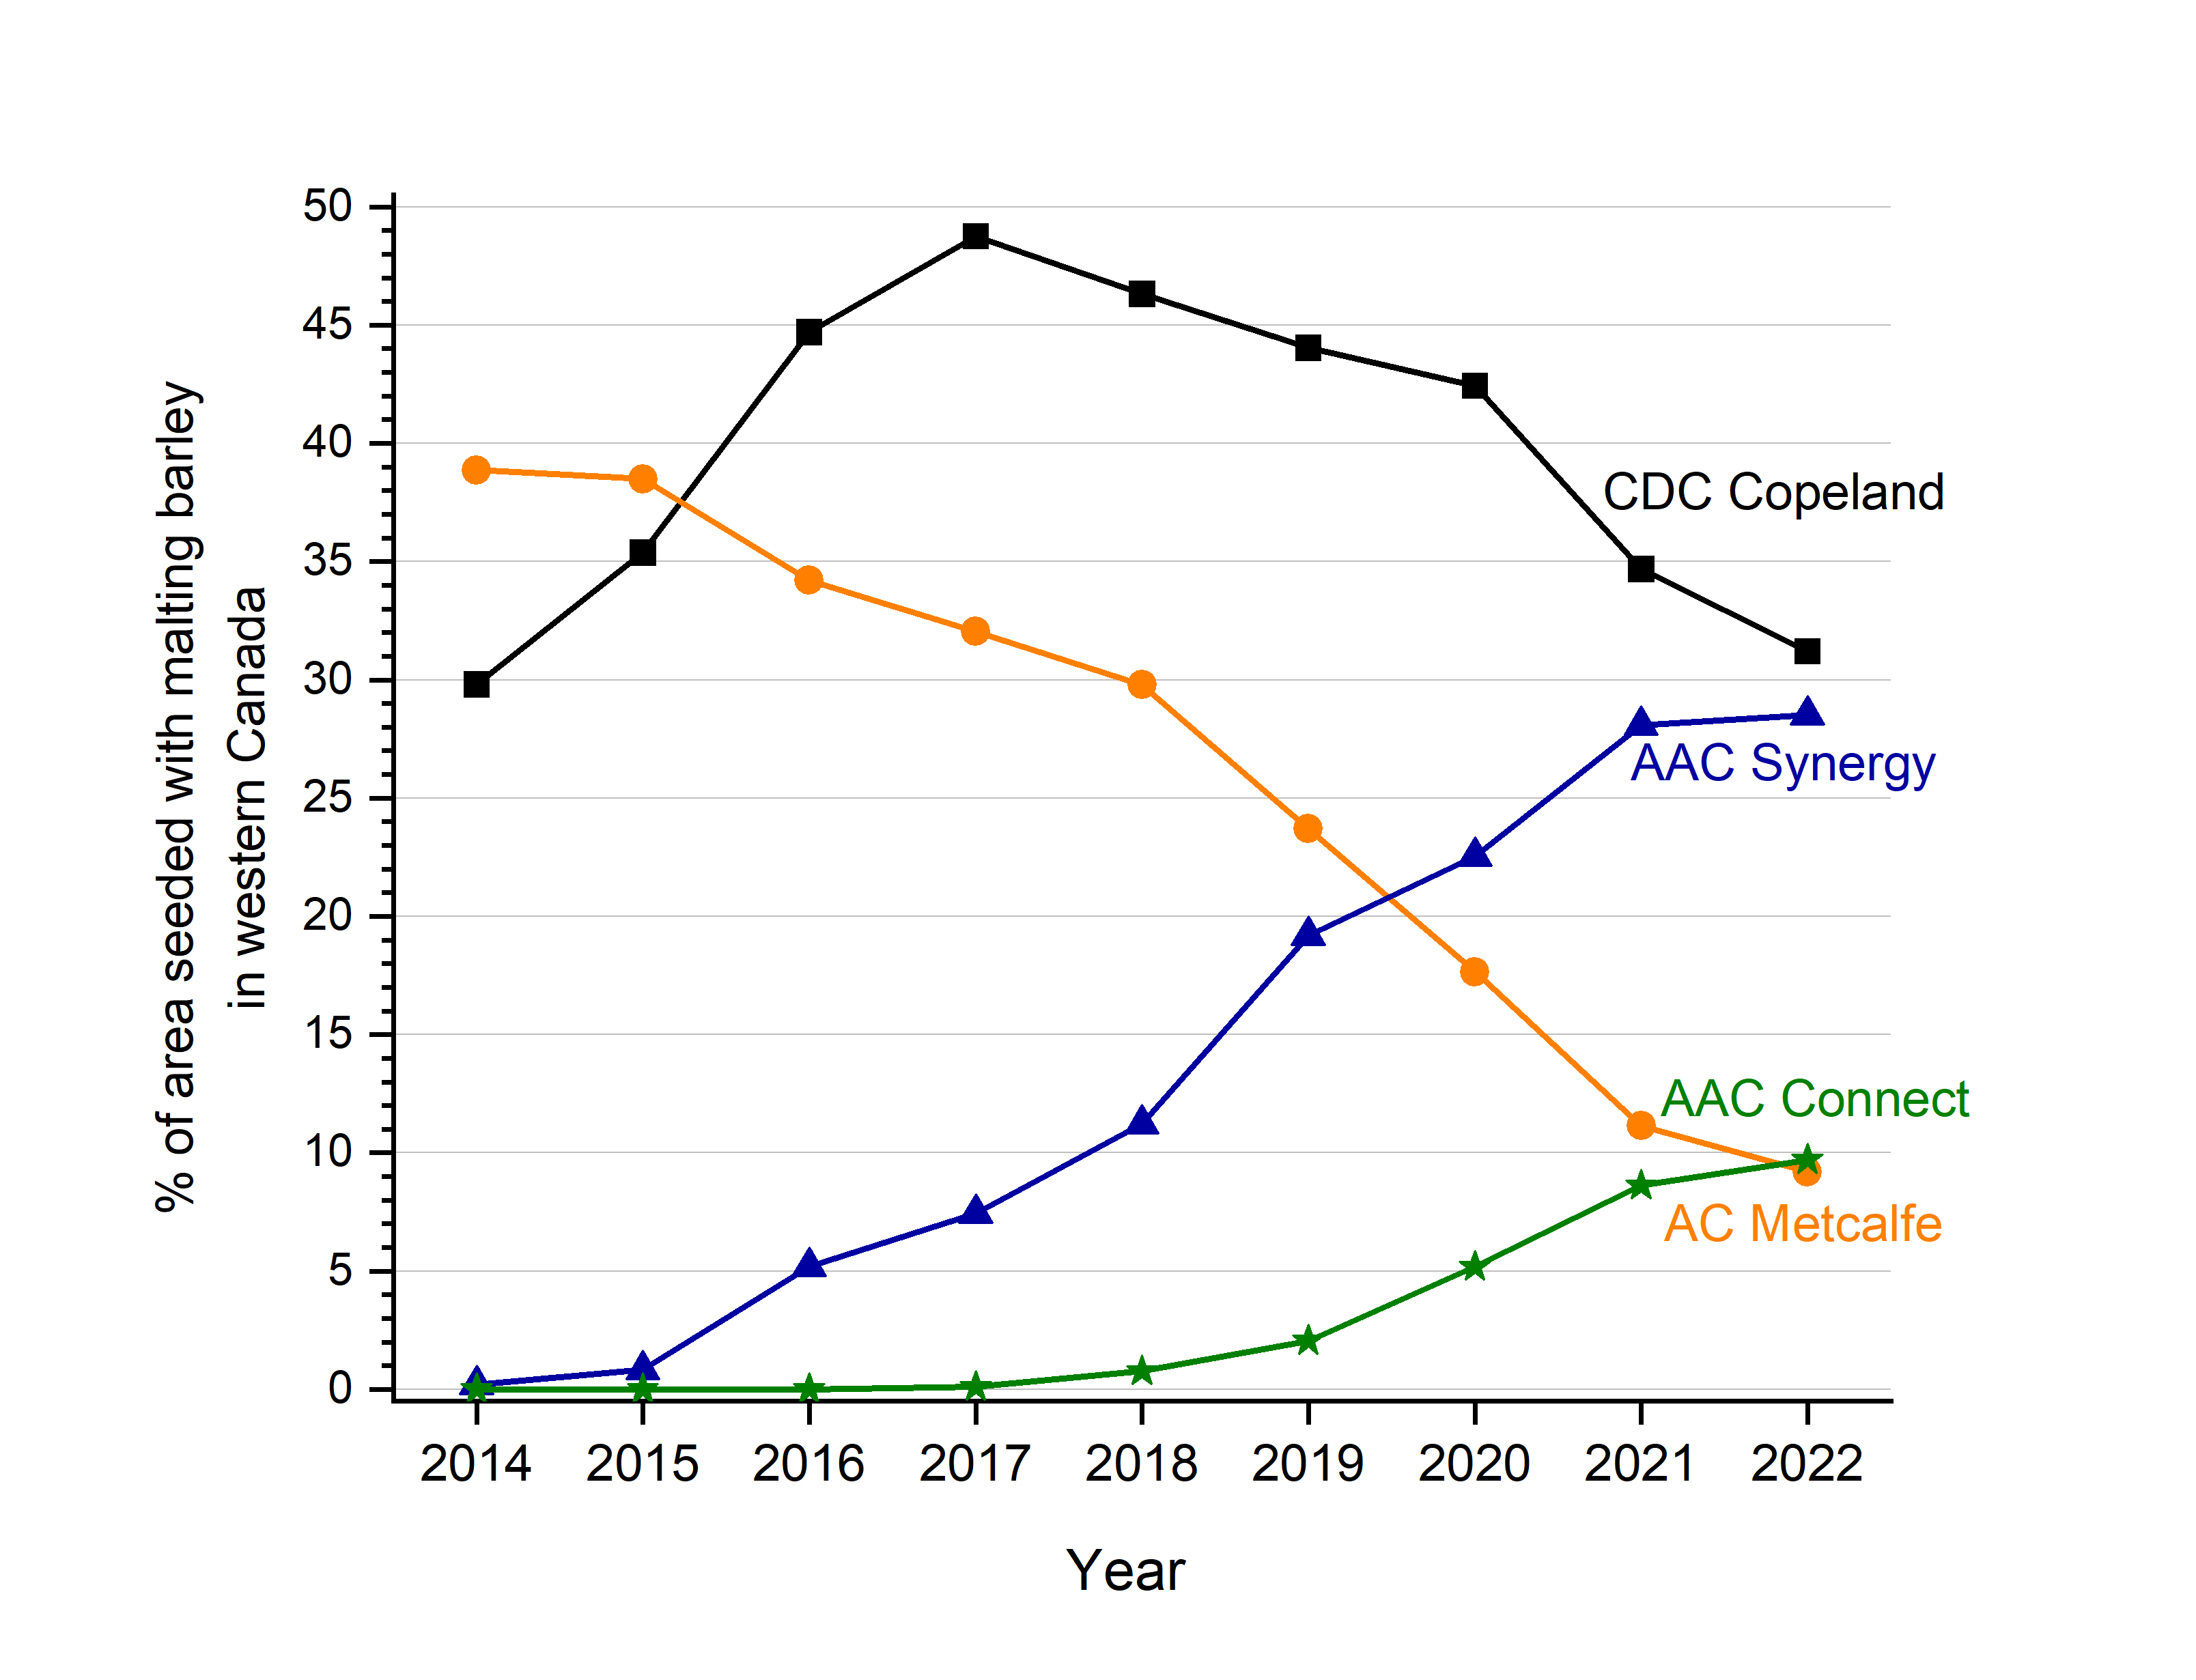
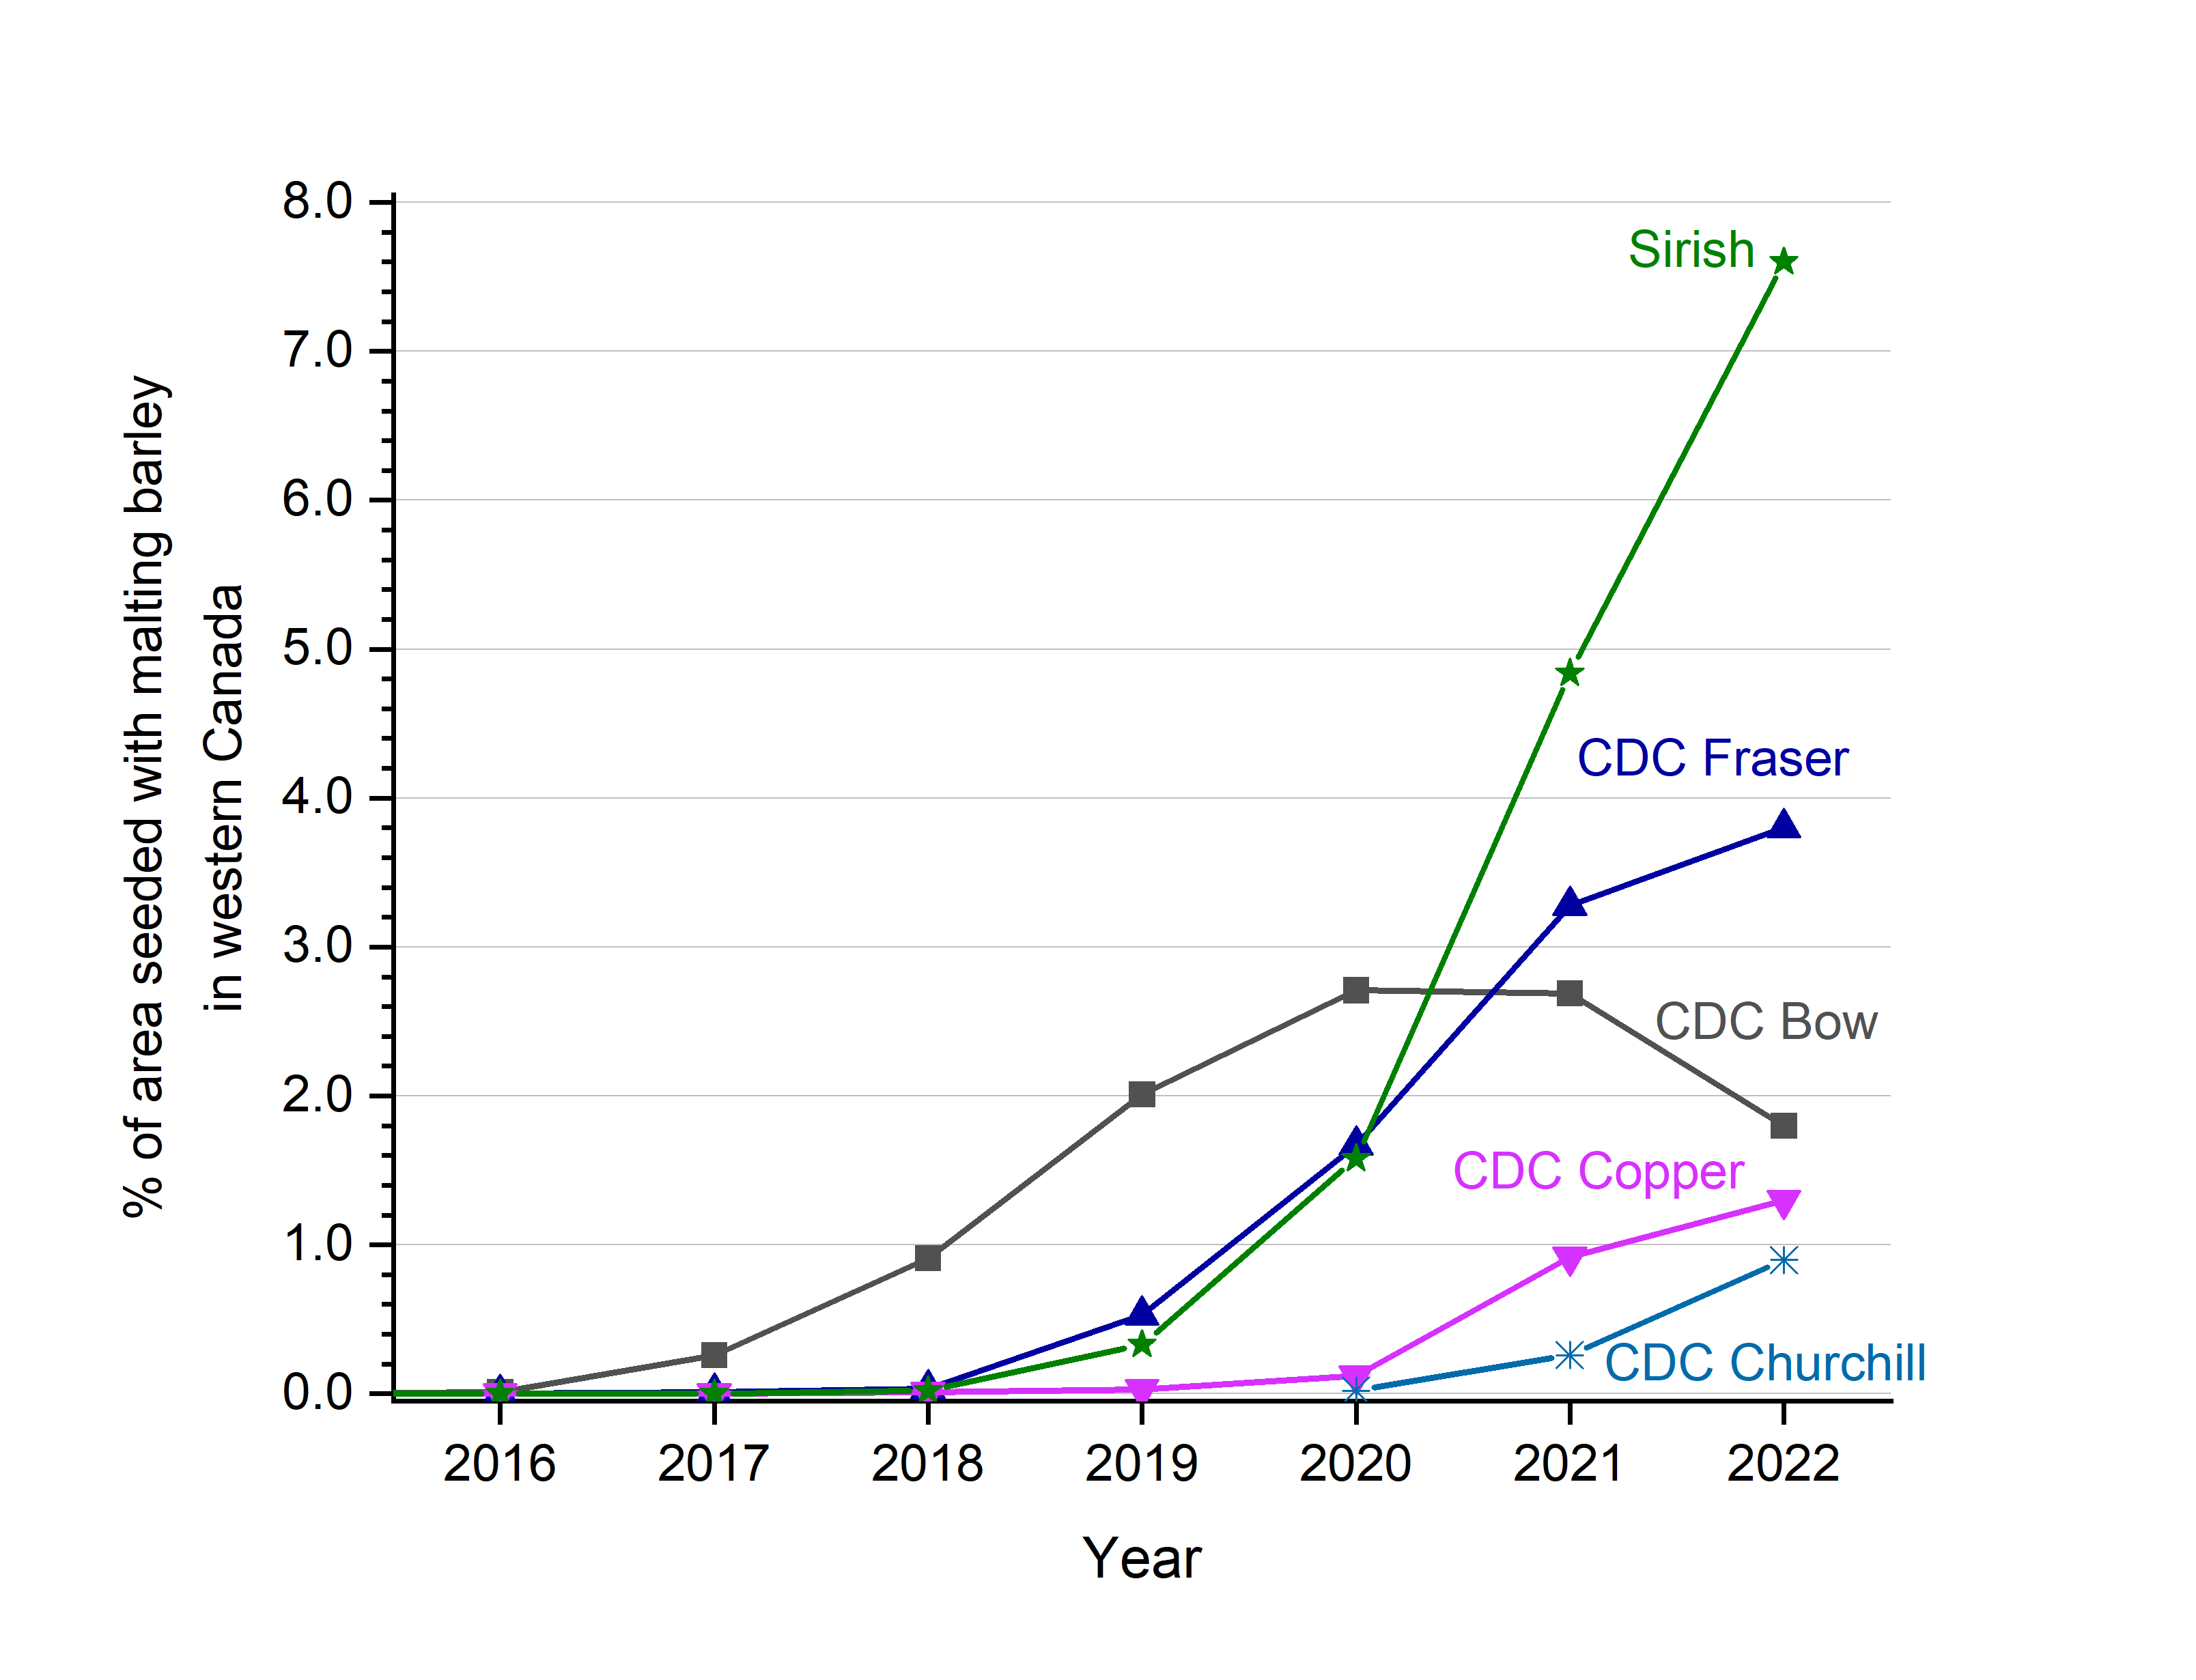
In 2022, CDC Copeland and AAC Synergy were the most common cultivars of malting barley grown in western Canada (Table 2.4). The area seeded with CDC Copeland was 31.2% in 2022, a decrease from 34.8% in 2021 (Table 2.4 and Figure 2.5). The area seeded with AAC Synergy, which has been steadily growing since 2015, increased only slightly to 28.5% from 28.2% in 2021. The area seeded with AC Metcalfe decreased to 9.2% from 11.2% in 2021 (Figure 2.5). AAC Connect is becoming a popular variety whose acreage shows a steady growth and in 2022, it increased to 9.7% from 8.7% in 2021. The area planted with recently registered two-rowed cultivars, especially CDC Fraser, CDC Copper, CDC Churchill, and Sirish, continued to grow. In 2022, the area planted with CDC Bow decreased to 1.9% from 2.7% in 2021 (Figure 2.6). The newer malting barley varieties accounted for approximately 15.4% of the total area seeded with malting barley varieties in western Canada (Table 2.4).
The production of six-rowed malting barley continued to decline. In 2022, six-rowed cultivars accounted for approximately 2.7% of the total area seeded with malting barley, down from 2.8% in 2021 and 3.3% in 2020. Legacy, Celebration and Tradition remained the top three six-rowed varieties (Table 2.4).
In each province, the production of two-rowed cultivars predominated (Table 2.4). CDC Copeland and AAC Synergy were predominant in Alberta and Saskatchewan. The area seeded with malting barley in Manitoba was relatively low, compared to other western provinces. In 2022, the most popular cultivars in Manitoba were AAC Synergy and AAC Connect, followed by CDC Copeland (Table 2.4).
Figure 2.5 Comparison of the area seeded with top malting barley cultivars in western Canada from 2014 to 2022Footnote3

Table 2.4 Distribution of malting barley cultivars as a percentage (%) of area seeded with malting barley in western Canada in 2022Footnote3
| % of area seeded with malting barley in western Canada in 2022 | ||||
|---|---|---|---|---|
| Malting barley cultivars | Alberta | Saskatchewan | Manitoba | Western Canada |
| 2-rowed | % | % | % | % |
| CDC Copeland | 13.31 | 16.78 | 0.81 | 31.15 |
| AAC Synergy | 11.95 | 14.87 | 1.54 | 28.49 |
| AAC Connect | 3.54 | 4.32 | 1.52 | 9.67 |
| AC Metcalfe | 4.06 | 4.45 | 0.55 | 9.19 |
| Sirish | 7.02 | 0.09 | 0.07 | 7.55 |
| CDC Fraser | 1.11 | 2.29 | 0.38 | 3.78 |
| CDC Bow | 0.98 | 0.71 | 0.12 | 1.82 |
| CDC Copper | 1.00 | 0.22 | 0.05 | 1.31 |
| CDC Churchill | 0.54 | 0.34 | 0.05 | 0.93 |
| Newdale | 0.08 | 0.40 | 0.34 | 0.83 |
| Cerveza | 0.57 | 0.10 | 0.04 | 0.71 |
| Bill Coors 100 | 0.57 | 0.04 | 0.00 | 0.61 |
| Bentley | 0.26 | 0.02 | 0.00 | 0.28 |
| CDC Meredith | 0.09 | 0.19 | 0.00 | 0.28 |
| CDC Goldstar | 0.00 | 0.15 | 0.00 | 0.15 |
| CDC Platinum Star | 0.00 | 0.15 | 0.00 | 0.15 |
| AB Brewnet | 0.08 | 0.00 | 0.00 | 0.08 |
| CDC Clear | 0.00 | 0.06 | 0.00 | 0.06 |
| Other | 0.21 | 0.12 | 0.00 | 0.33 |
| Total 2-rowed | 45.56 | 45.30 | 5.47 | 97.34 |
| 6-rowed | % | % | % | % |
| Legacy | 0.35 | 1.54 | 0.04 | 1.94 |
| Celebration | 0.00 | 0.16 | 0.31 | 0.47 |
| Tradition | 0.00 | 0.00 | 0.16 | 0.16 |
| Other | 0.06 | 0.00 | 0.03 | 0.09 |
| Total 6-rowed | 0.42 | 1.70 | 0.54 | 2.66 |
Distribution of general purpose and food barley varieties
Based on the 2022 insured acreage in western Canada, food (F) and general purpose (GP) barley varieties accounted for 46.7% of the total area seeded with barley (Figure 2.4b). CDC Austenson continued to predominate the area seeded with GP barley cultivars; however, the area seeded with CDC Austenson decreased to 41.5% in 2022 from 46.0% in 2021. (Table 2.5 and Figure 2.7). The area seeded with Brahma, Oreana, and Claymore decreased slightly in 2022 compared to 2021. The acreage of CDC Maverick increased from 3.5% in 2021 to 4.9% in 2022.
Figure 2.7 Comparison of areas seeded with the top five general purpose and food barley cultivars in western Canada from 2016 to 2022Footnote3

Table 2.5 Distribution of barley cultivars as a percentage (%) of area seeded with general purpose and food barley in western Canada in 2022Footnote3
| % of area seeded with general purpose and food barley in western Canada in 2022 | ||||
|---|---|---|---|---|
| General purpose and food barley cultivars | Alberta | Saskatchewan | Manitoba | Western Canada |
| CDC Austenson | 20.19 | 16.09 | 4.97 | 41.45 |
| Brahma | 9.12 | 0.09 | 0.00 | 9.43 |
| Oreana | 6.02 | 0.78 | 0.03 | 6.83 |
| Claymore | 3.03 | 2.44 | 0.41 | 5.88 |
| Canmore (F) | 4.38 | 0.13 | 0.61 | 5.12 |
| CDC Maverick | 1.62 | 3.08 | 0.17 | 4.87 |
| Conlon | 1.88 | 0.11 | 2.19 | 4.18 |
| Champion | 2.64 | 0.90 | 0.03 | 3.57 |
| Xena | 2.94 | 0.32 | 0.00 | 3.26 |
| CDC Coalition | 2.81 | 0.00 | 0.00 | 2.81 |
| Esma | 2.17 | 0.08 | 0.22 | 2.47 |
| Altorado | 1.52 | 0.58 | 0.11 | 2.21 |
| CDC Cowboy | 0.83 | 0.94 | 0.00 | 1.77 |
| AB Cattlelac | 0.76 | 0.48 | 0.11 | 1.35 |
| AB Advantage | 0.84 | 0.48 | 0.00 | 1.33 |
| AC Rosser | 0.08 | 0.24 | 0.00 | 0.32 |
| CDC Thompson | 0.28 | 0.00 | 0.00 | 0.28 |
| Sundre | 0.14 | 0.11 | 0.00 | 0.26 |
| Ponoka | 0.25 | 0.00 | 0.00 | 0.25 |
| Seebe | 0.23 | 0.00 | 0.00 | 0.23 |
| Amisk | 0.23 | 0.00 | 0.00 | 0.23 |
| CDC Trey | 0.23 | 0.00 | 0.00 | 0.23 |
| Gadsby | 0.16 | 0.04 | 0.00 | 0.20 |
| AB Wrangler | 0.09 | 0.05 | 0.00 | 0.14 |
| AB Hague | 0.07 | 0.06 | 0.00 | 0.13 |
| Alston | 0.11 | 0.00 | 0.00 | 0.11 |
| CDC McGwire (HB, F) | 0.00 | 0.11 | 0.00 | 0.11 |
| Other | 0.69 | 0.16 | 0.03 | 0.97 |
| Total general purpose and food | 63.3 | 27.3 | 8.9 | 100 |
"Page details"
- Date modified:
