Quality of western Canadian canola 2021
Fatty acid composition
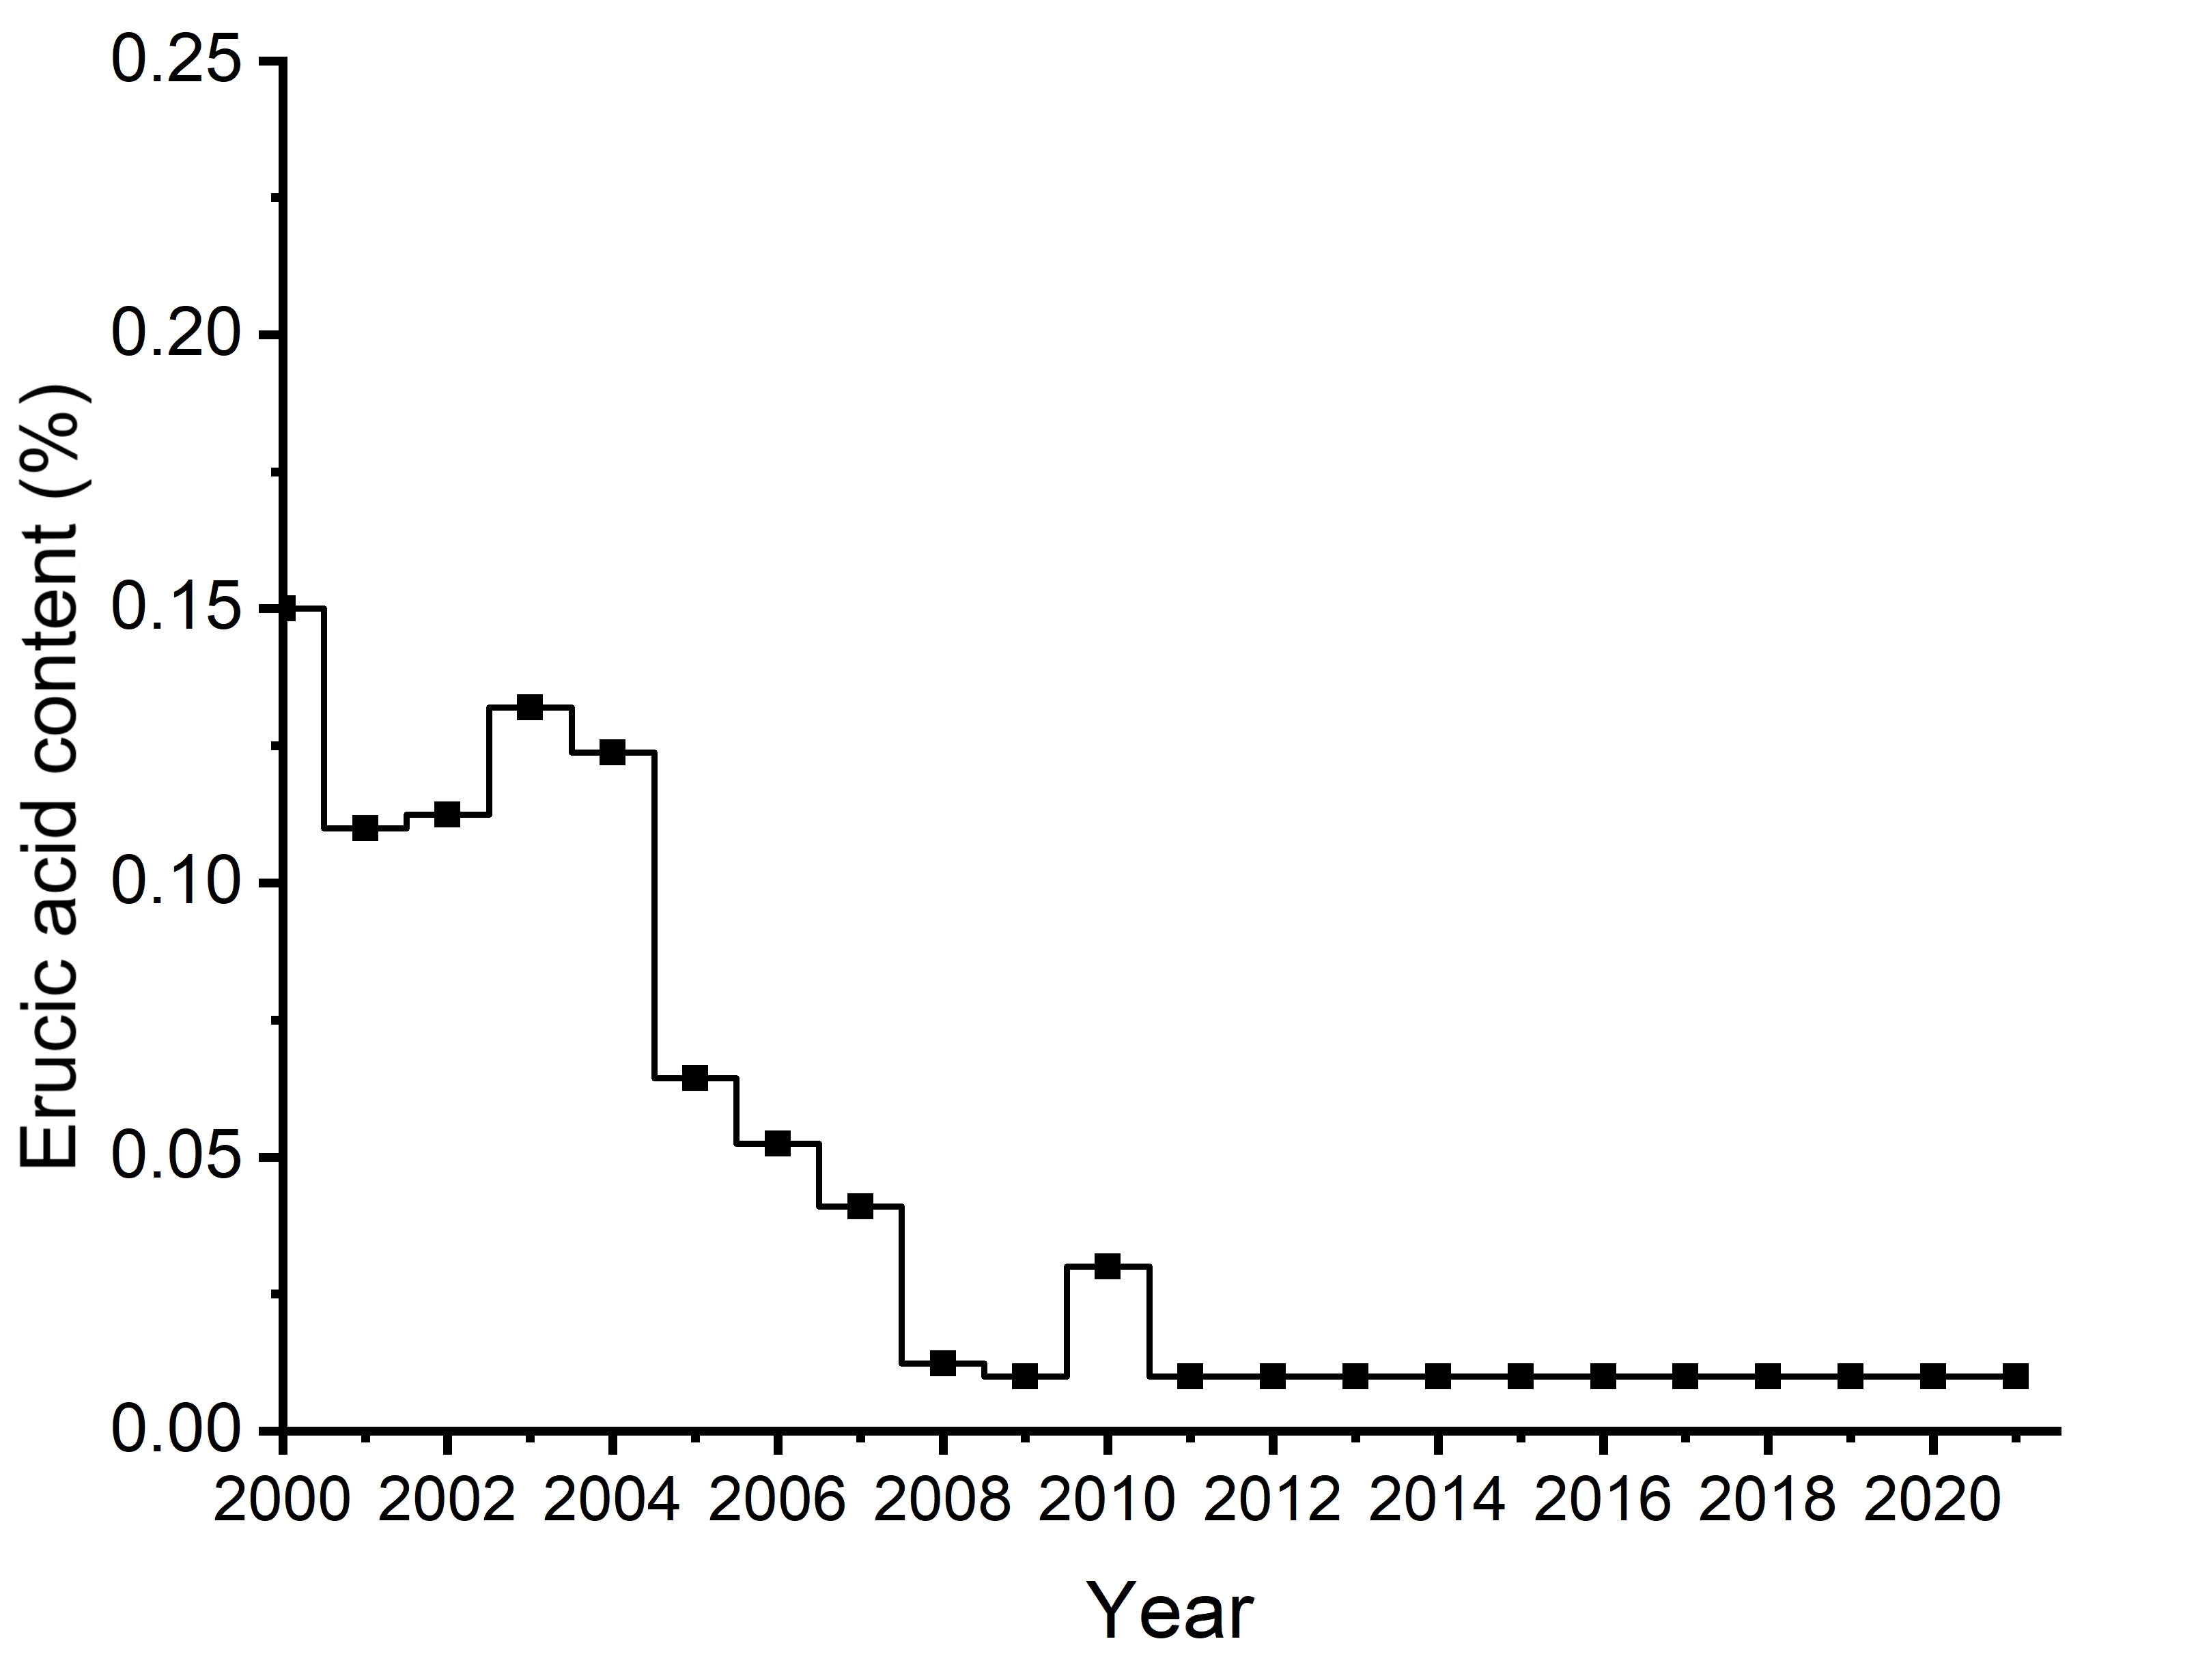
The average erucic acid (C22:1) content of the 2021 canola crop was 0.01%. Over the last several years, its average content in Canola, No. 1 Canada samples ranged from below limit of detection to 0.01% (Tables 1 and 3, Figure 14a). Similar to the total glucosinolate content, these low values are a direct result of breeding efforts by the Canadian canola industry.
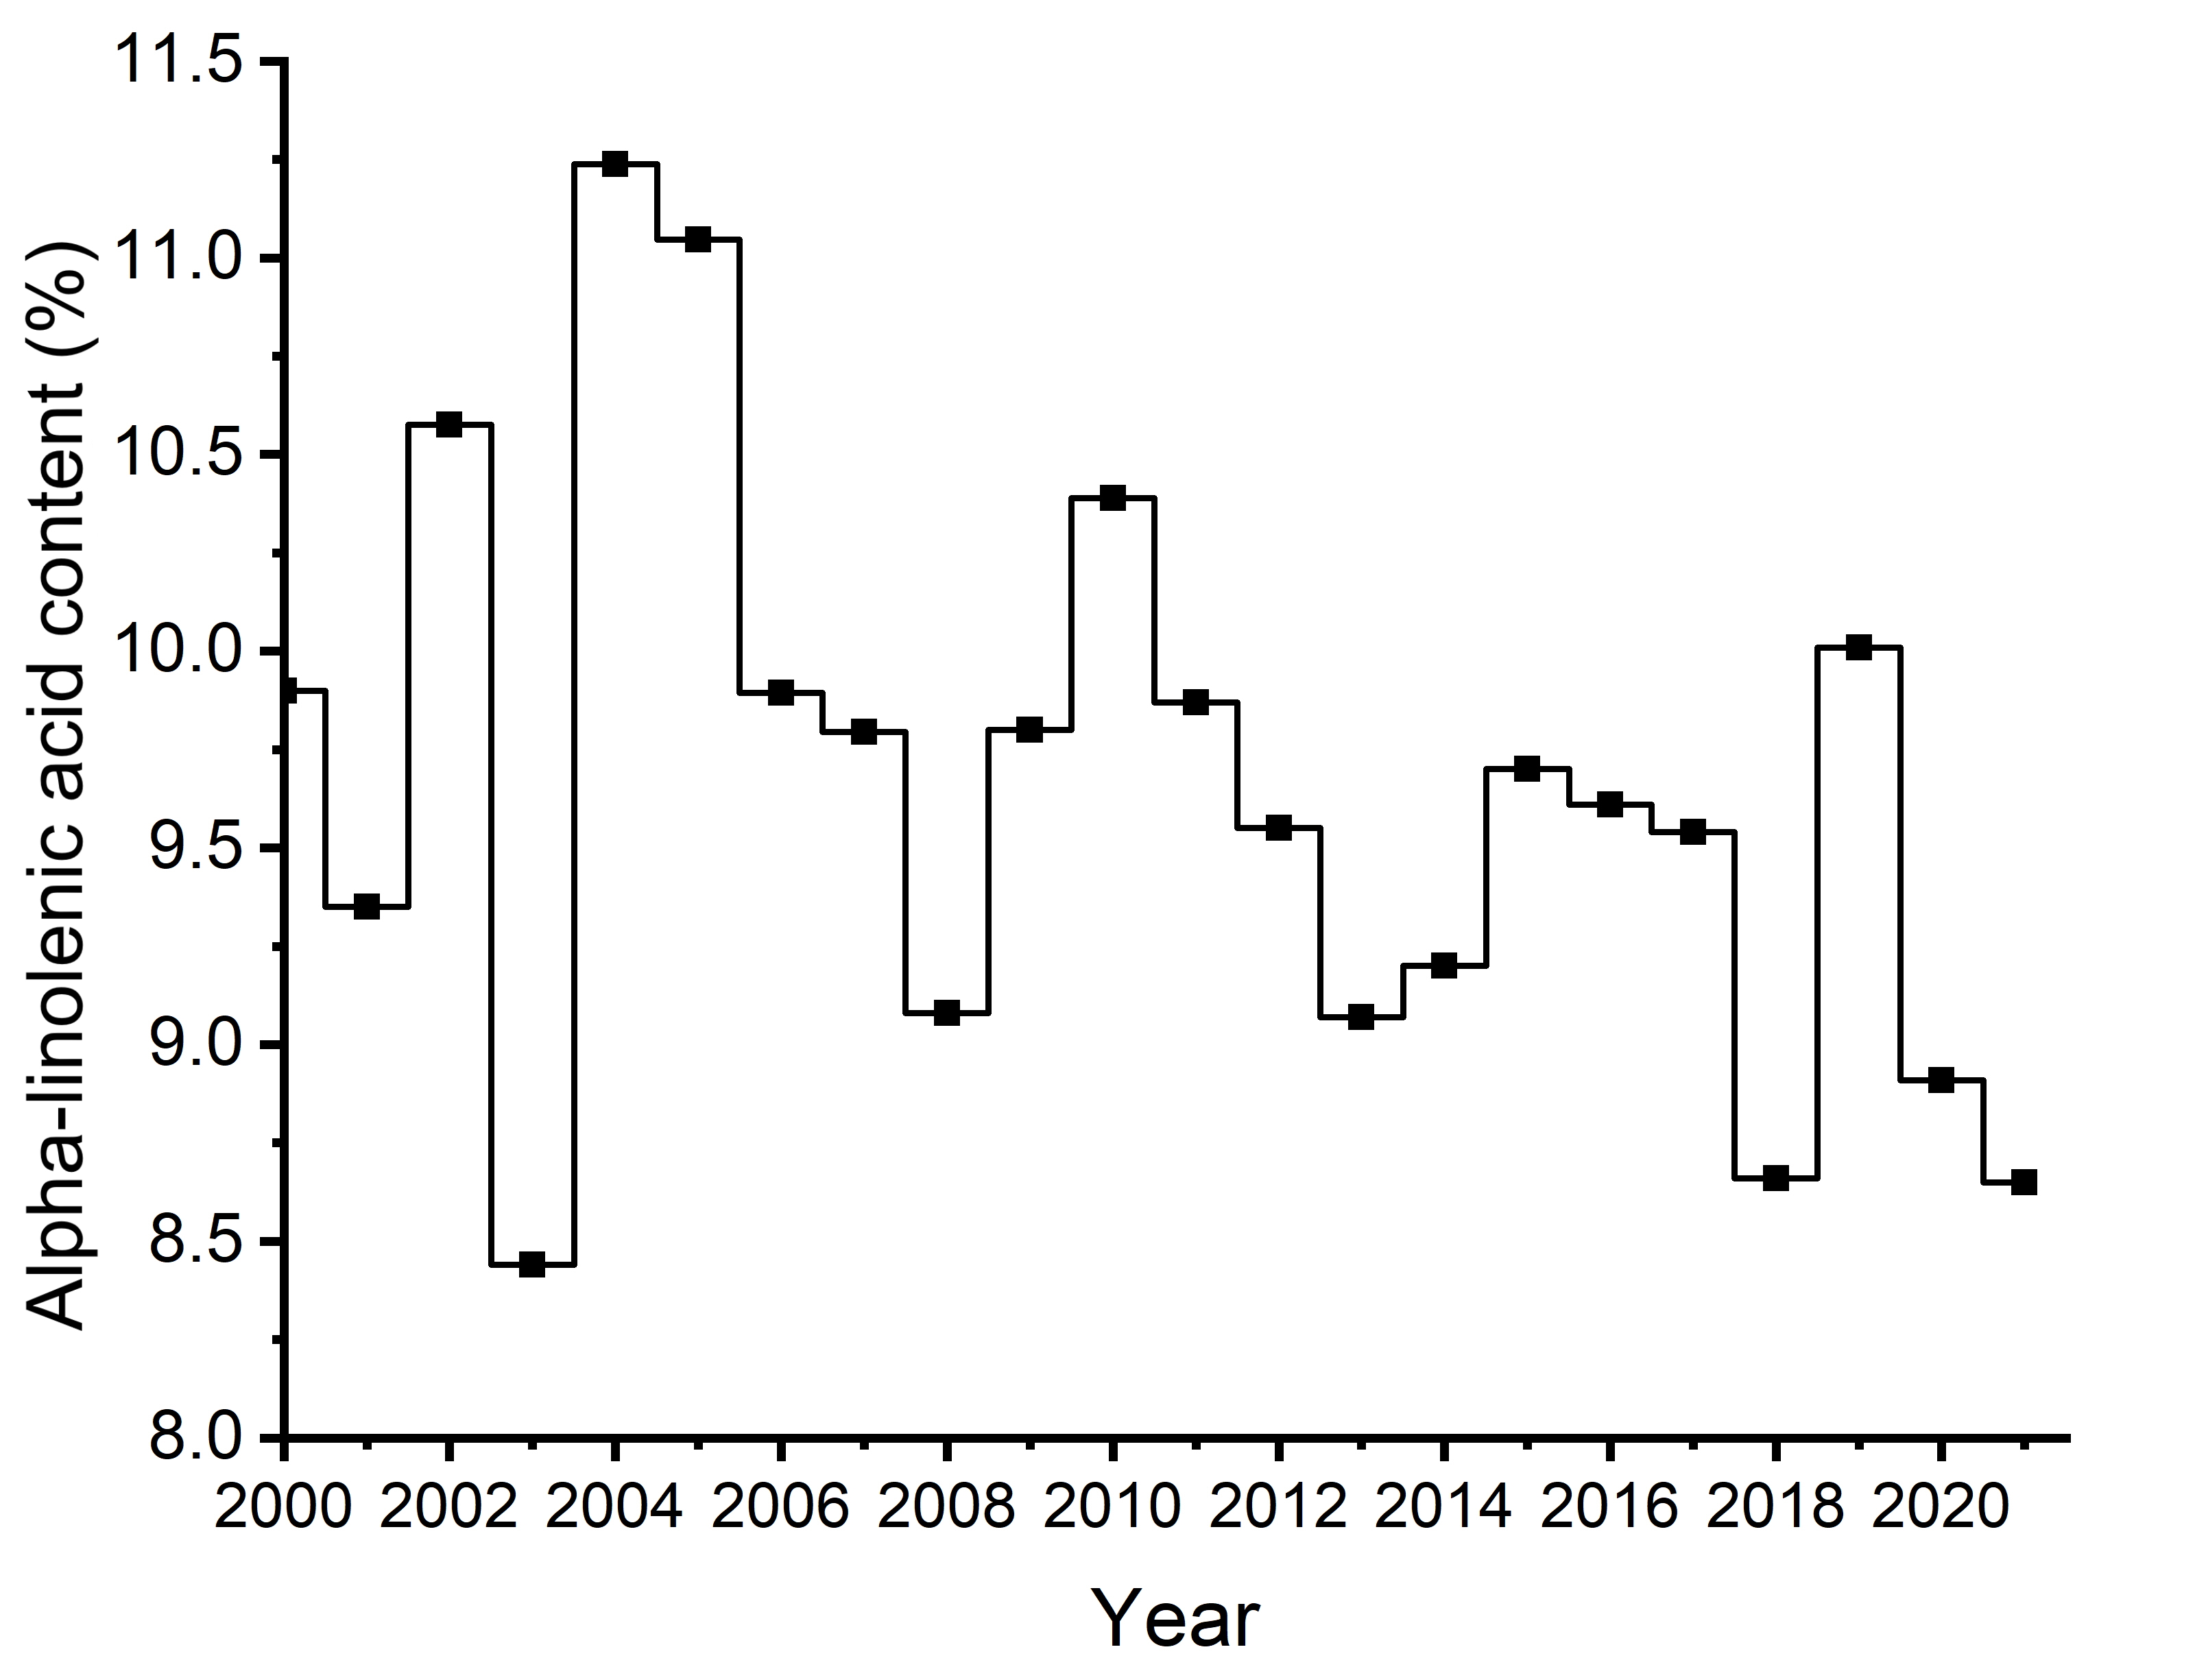
In 2021. the average α-linolenic acid (C18:3) content of Canola, No. 1 Canada was 8.6%, which is lower than the 2020 average (8.9%) and much lower than the 5-year average (9.3%; Table 1 and Figure 14b). Samples from Manitoba and Saskatchewan had the same average α-linolenic acid content (8.4%), whereas samples from Alberta-Peace River had a slightly higher average (9.2%; Table 3). Samples from the most northwest part of Alberta-Peace River (crop districts 6 and 7) had the highest average α-linolenic acid content (10.0% and 10.4% for crop districts 6 and 7, respectively), whereas samples from southern Saskatchewan had the lowest average range (7.1% to 7.7%).
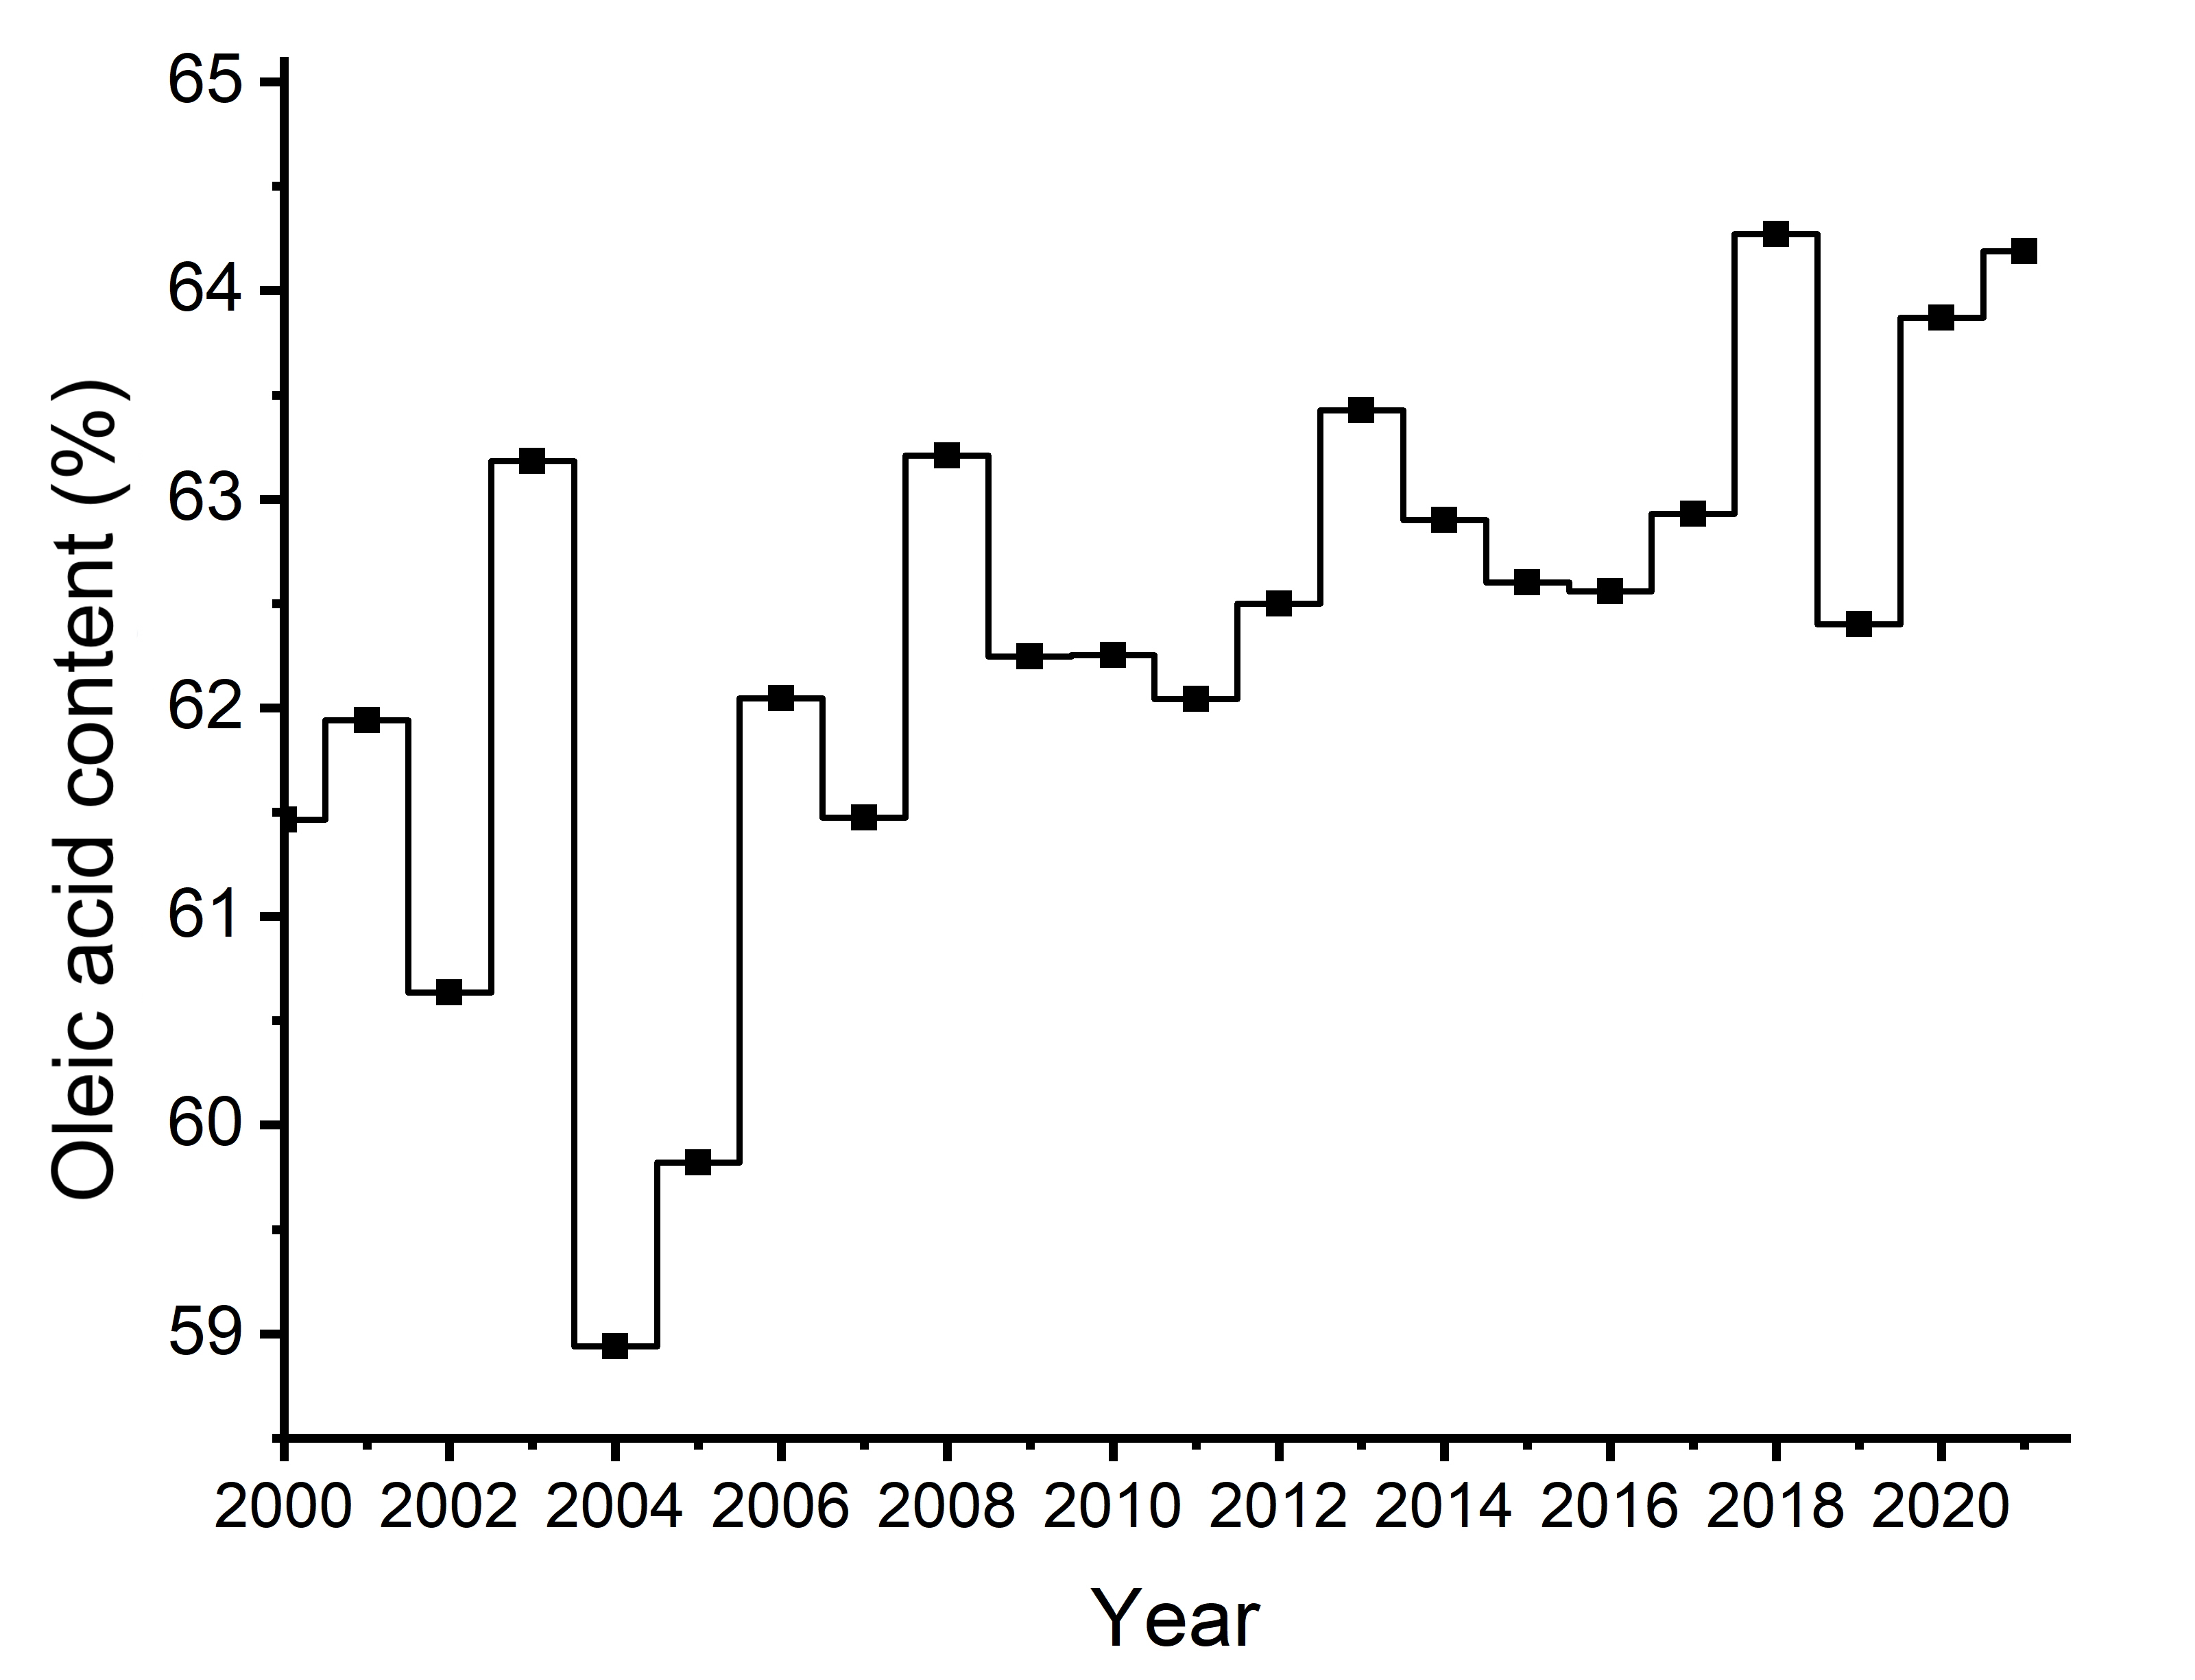
In 2021, the average oleic acid (C18:1) content of Canola, No. 1 Canada samples was 64.2%, which is higher than the 2020 average (63.9%) and the 5-year average (63.2%; Table 1 and Figure 14c). The lowest average oleic acid content was found in samples from Alberta-Peace River (63.8% in 2021 versus 62.7% in 2020), whereas the highest average was obtained from Saskatchewan (64.4% in 2021 versus 65.1% in 2020; Table 3).
The total content of monounsaturated fatty acids (MUFA) in 2021 samples was 65.9% in Manitoba (65.8% in 2020), 66.0% in Saskatchewan (66.7% in 2020) and 65.4% in Alberta-Peace River (64.3% in 2020). The average for western Canada was 66.0% (65.4% in 2020; Table 3).
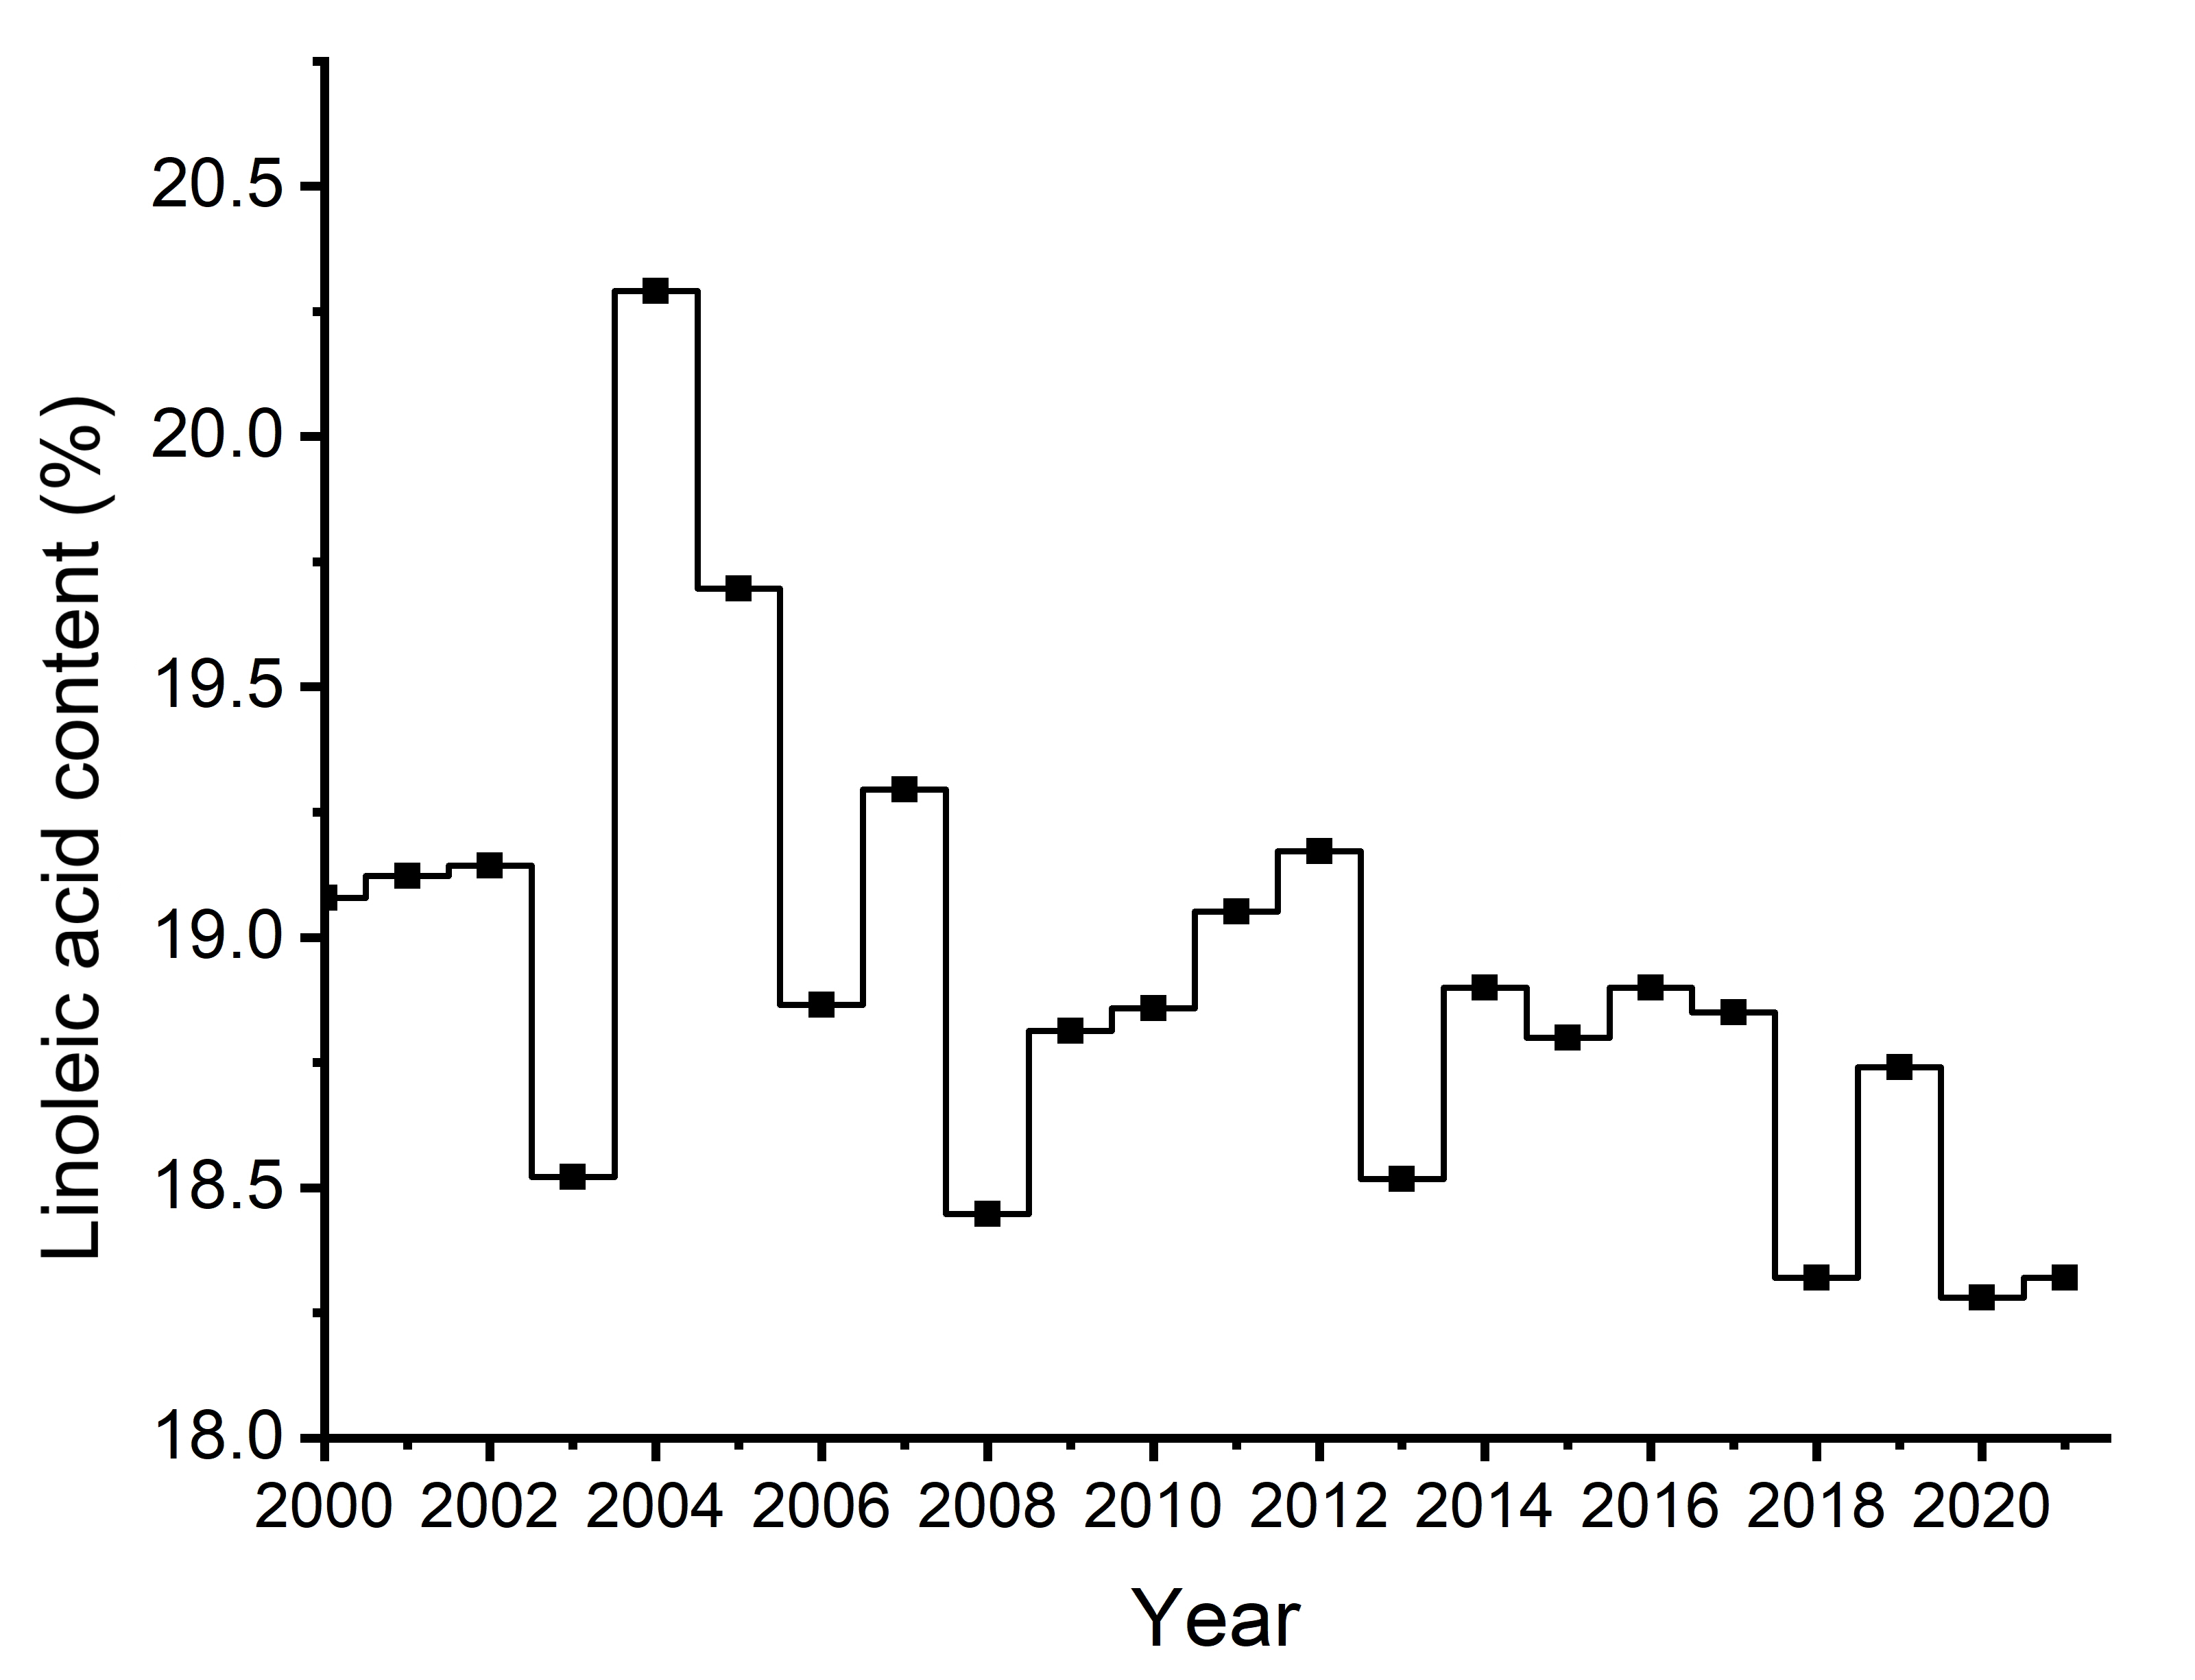
Linoleic acid (C18:2; Figure 14d) content followed a similar pattern to that of α-linolenic acid (Figure 14b) in response to environmental conditions since hot and dry growing conditions can also reduce the linoleic acid content of canola seeds. This year’s average was one of the lowest from the last 10 years, but identical to the 2018 average of 18.3% (Figure 14d).
In 2021, the total average content of polyunsaturated fatty acids (PUFA) was 26.9% in Manitoba (26.8% in 2020), 26.8% in Saskatchewan (26.8% in 2020) and 27.4% in Alberta-Peace River (28.5% in 2020). This resulted in an overall average of 27.0% for western Canada (27.3% in 2020; Table 1 and Table 3). In canola, PUFA content is directly related to the α-linolenic acid (C18:3) and linoleic acid (C18:2) content. After flowering, the hot temperatures in August 2021 (Figure 5) led directly to the low total unsaturated content in canola seed oil (similar to 2020) and as a result, PUFA content was lower compared to 2019. The northern and the southern parts of the prairies were affected differently by the hot temperatures. Crop districts 6 and 7 of Alberta-Peace River produced canola with the highest PUFA content at 29.3% and 28.7%, respectively.
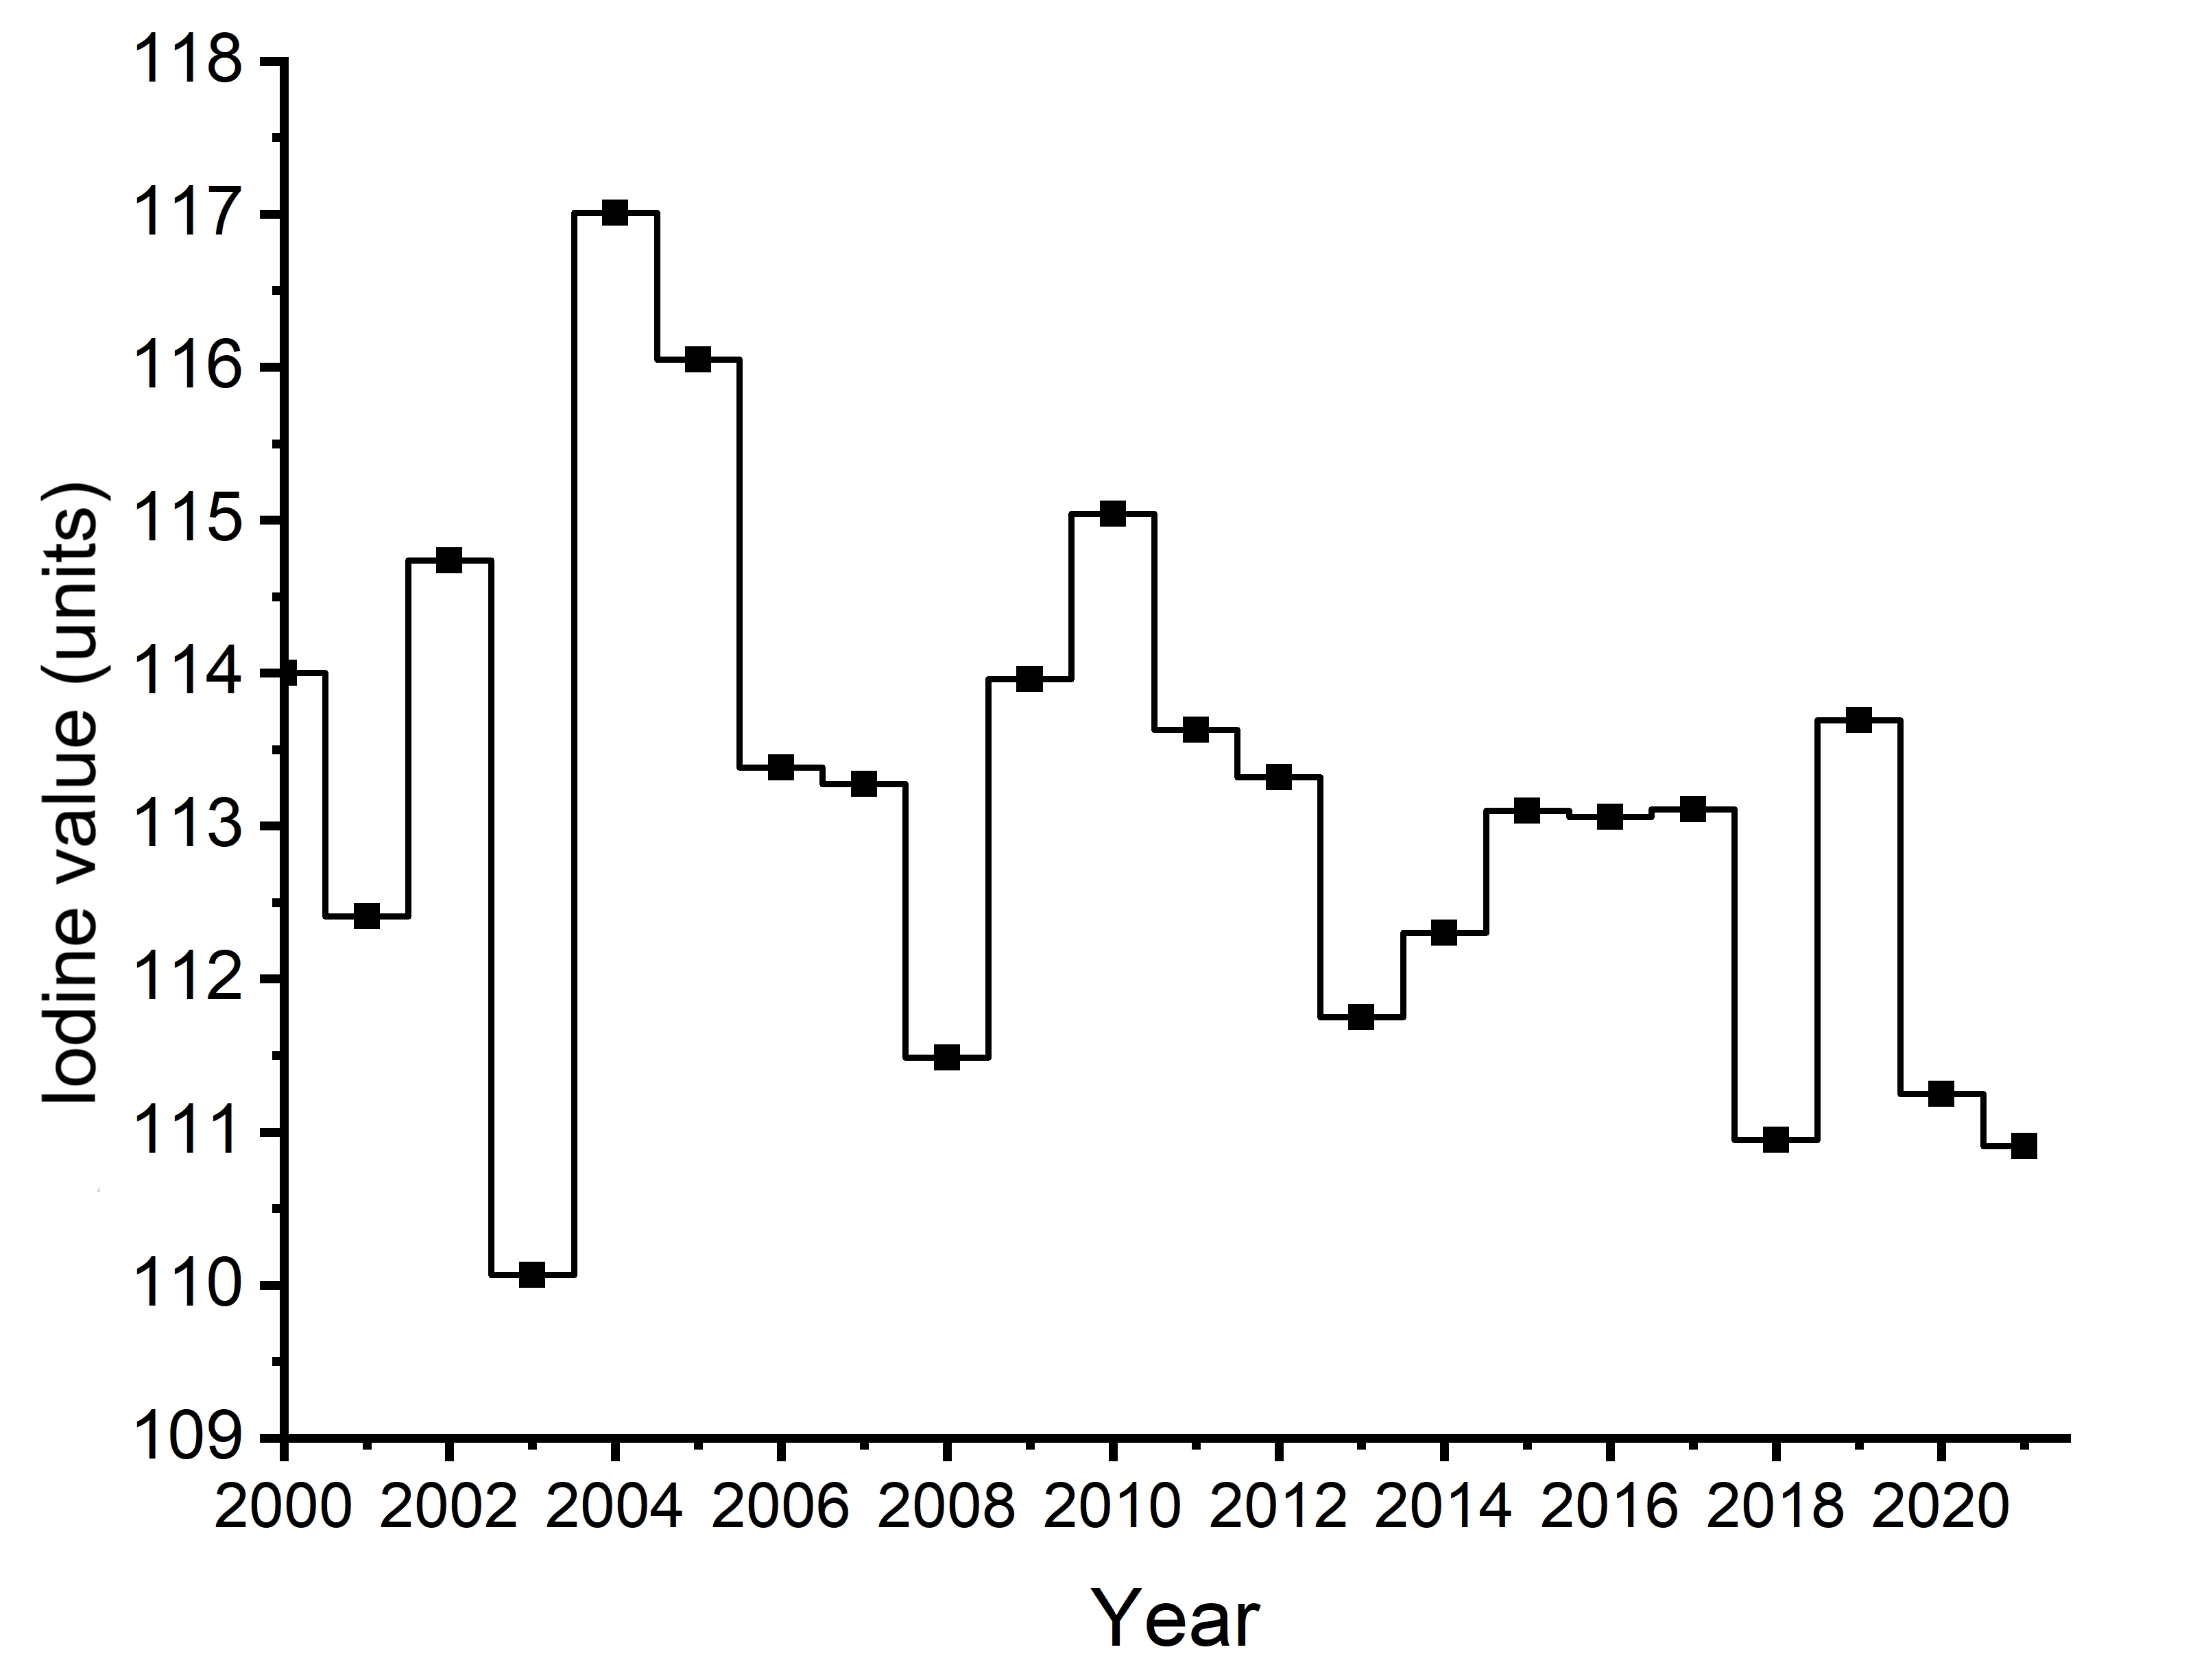
Fatty acid composition (oleic acid, linoleic acid and α-linolenic acid) in the 2021 crop was slightly different when compared to 2020 (0.3% higher for oleic acid, equal for linoleic acid and 0.3 % down for α-linolenic acid). As a result, the iodine value, which is a representation of the degree of unsaturation of oil, was slightly lower in 2021 (110.9 units) when compared to 2020 (111.2 units) (Table 1). It was the second lowest iodine value observed over the last 10 years and identical to 2018 (Figure 14e). The 2021 iodine value was 1.5 units lower than the 5-year average of 112.4 units (Table 1). For Canola, No. 1 Canada, the iodine value averages were 110.6 units (110.3 units in 2020), 110.5 units (109.2.4 units in 2020) and 111.7 units (113.3 units in 2020) for Manitoba, Saskatchewan and Alberta-Peace River, respectively (Table 3). This year, the iodine value of individual Canola, No. 1 Canada samples ranged from 104.5 units to 119.1 units while in 2020 they ranged from 103.6 units to 121.5 units. Samples graded Canola, No. 2 Canada showed higher average iodine values, with higher linoleic and α-linolenic acid content, and lower oleic acid content than the Canola, No. 1 Canada samples (Table 3).
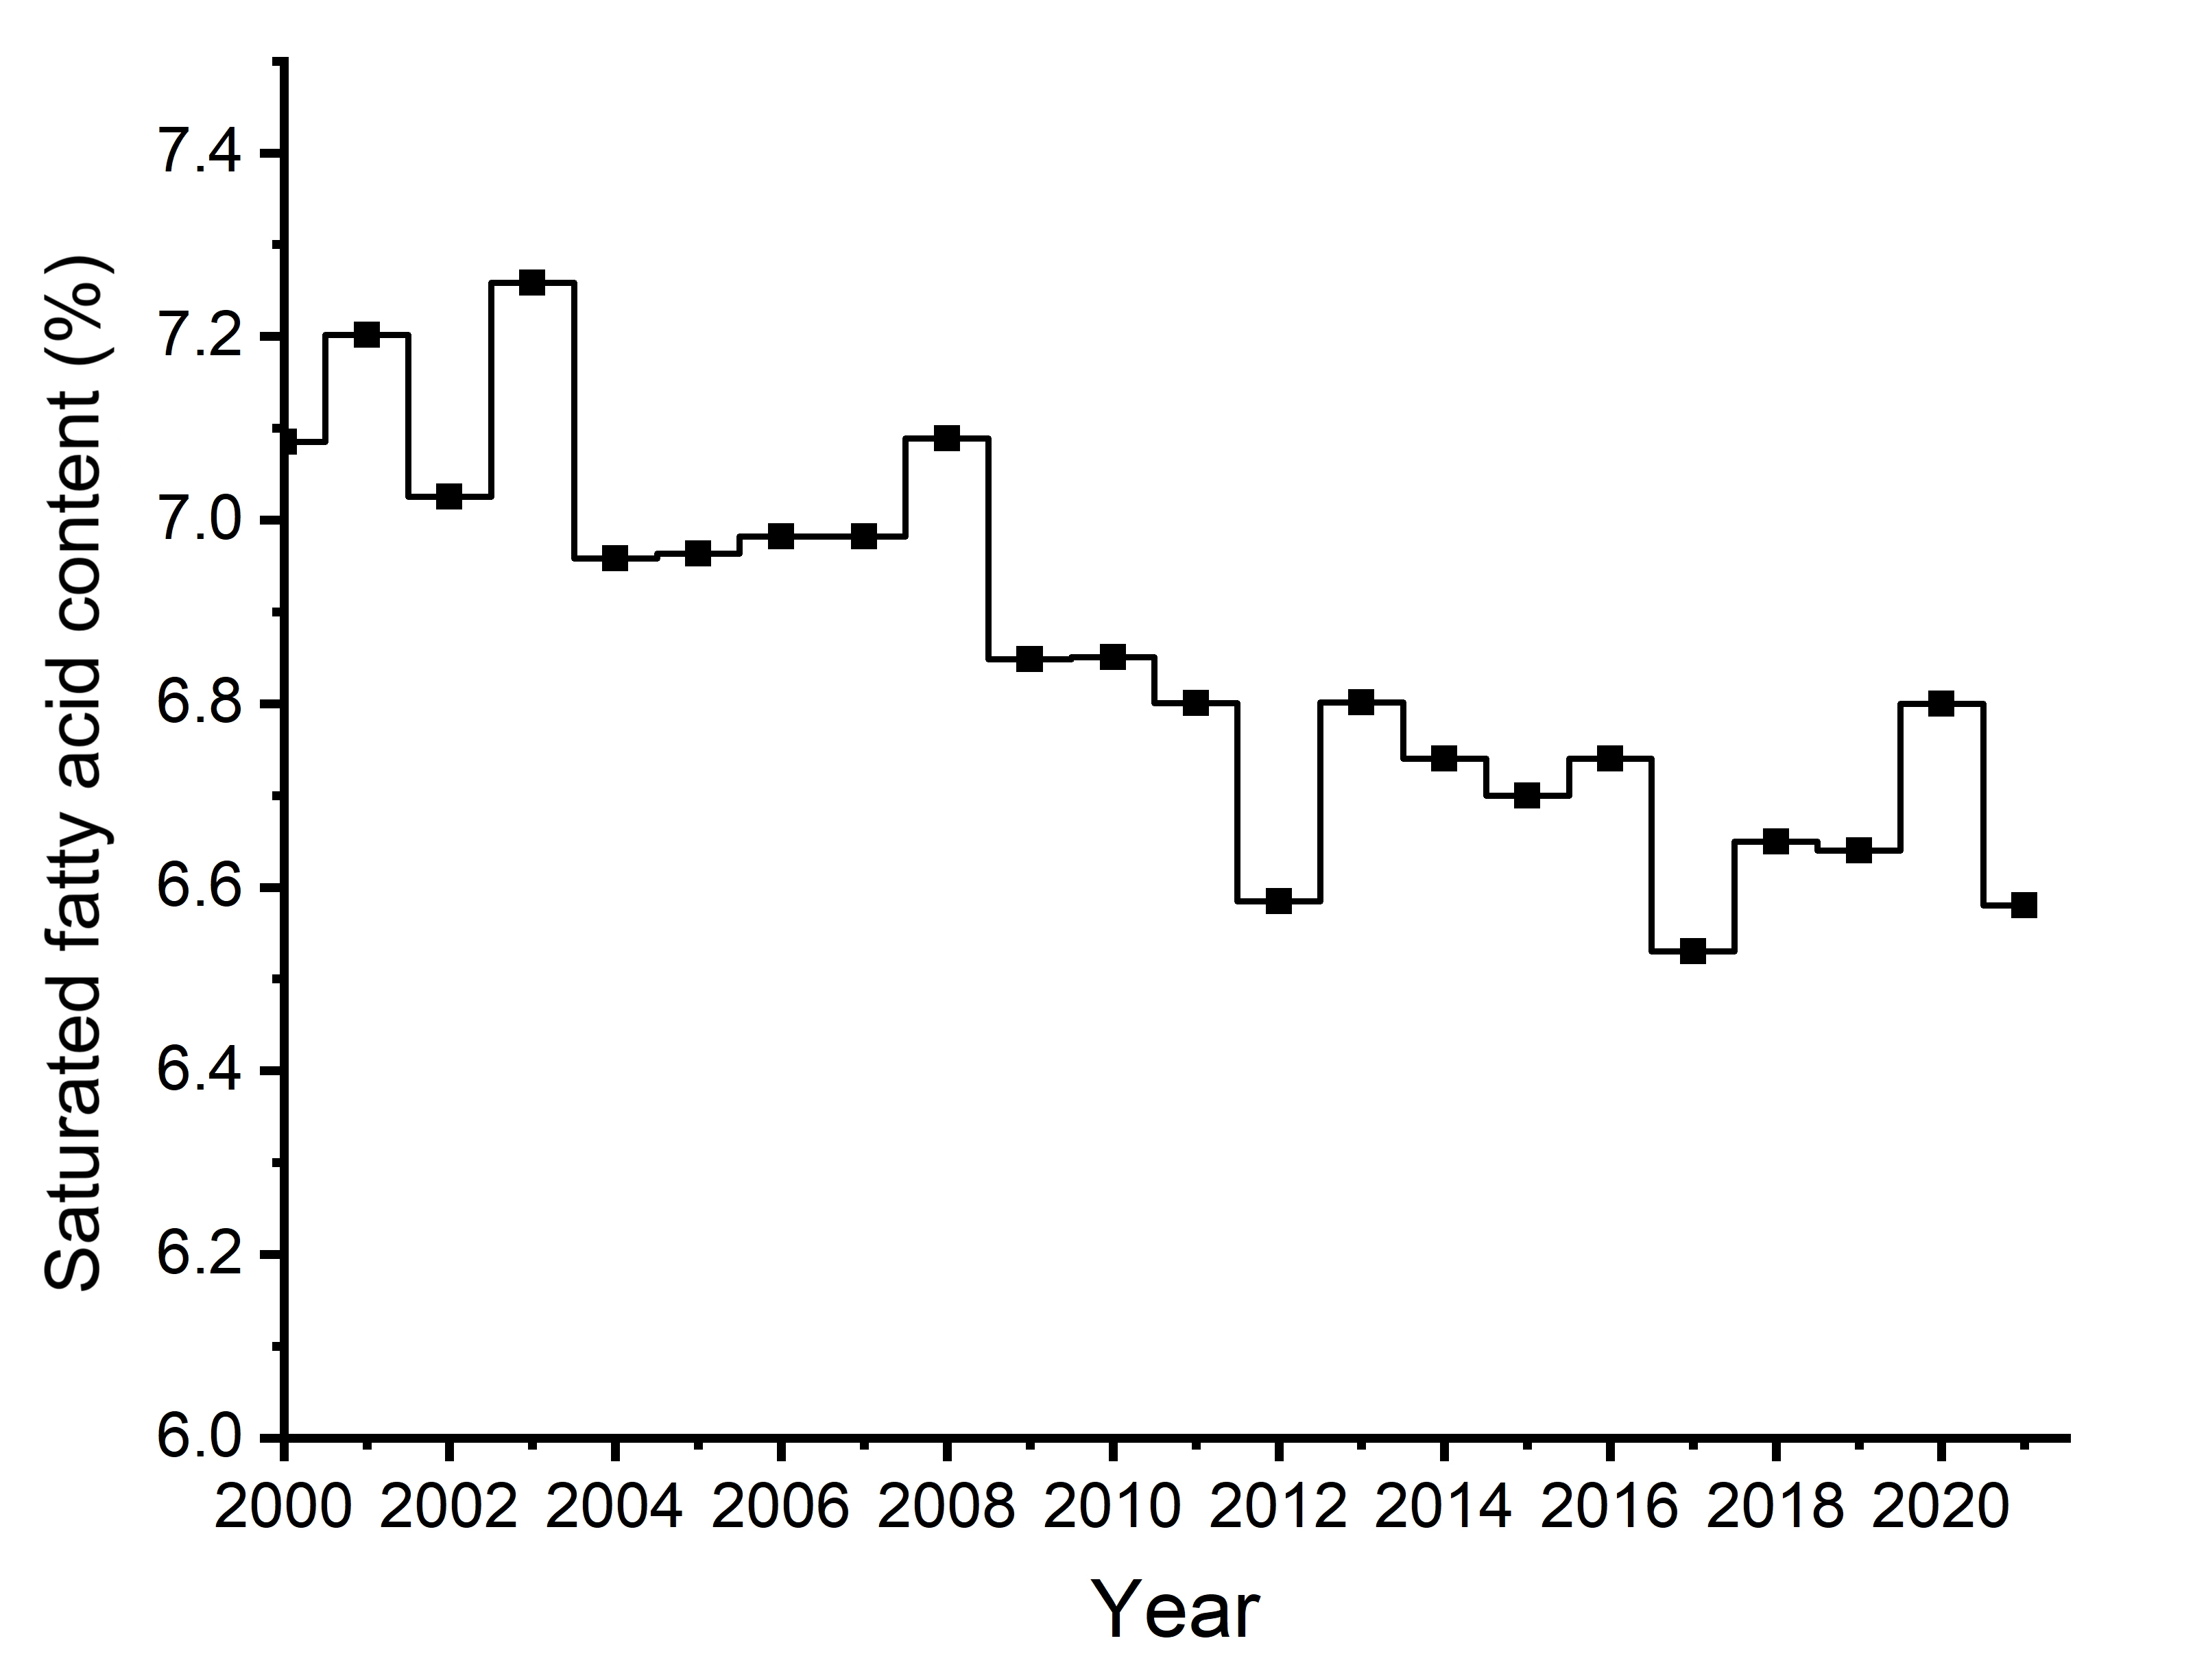
The average saturated fatty acid content was 6.6% in 2021, which is slightly lower than the 2020 average of 6.8% and the 5-year average of 6.7% (Tables 1 and 3). Since 2009, the average saturated fatty acid content varied from 6.6% to 6.9% (Figure 14f). In 2021, the average saturated fatty acid content was similar for the three prairie provinces at 6.6%, 6.6% and 6.5% for Manitoba, Saskatchewan and Alberta-Peace River, respectively (Table 3).
Total saturated fatty acid content, controlled through plant breeding, has been very stable. It was lower than 7.0% and has ranged from 6.6% to 6.9% since 2009 (Figure 14f). However, other fatty acids (except erucic acid) are greatly affected by genetic and environmental factors. This year, individual samples of Canola, No. 1 Canada, had oleic acid, linoleic acid and α-linolenic acid content that ranged from 56.5% to 69.8%, 15.8% to 21.0% and 5.1% to 13.1%, respectively. Samples from southern Alberta-Peace River (crop districts 1, 2, and 3) had a very different fatty acid composition than samples from northern Alberta-Peace River (crop districts 6 and 7). In general, oil in samples from northern areas, especially Alberta-Peace River, had higher unsaturation than oil in samples from southern areas. The hot and dry growing conditions this year and the number of days over 30°C after flowering, helped to decrease the total unsaturation of the oils and especially reduced the PUFA content.
The fatty acid composition of the 2021 harvest corresponded well with the fatty acid composition from the August to December 2021 exports compared to last year (Table 4).
Figure 14a Erucic acid content of the oil (%) for Canola, No. 1 Canada
-
Details
Figure 14a Erucic acid content of the oil (%) for Canola, No. 1 Canada Year Erucic acid content (%) 2000 0.15 2001 0.11 2002 0.11 2003 0.13 2004 0.12 2005 0.06 2006 0.05 2007 0.04 2008 0.01 2009 0.01 2010 0.03 2011 0.01 2012 0.01 2013 0.01 2014 0.01 2015 0.01 2016 0.01 2017 0.01 2018 0.00 2019 0.00 2020 0.01 2021 0.01
Figure 14b Alpha-linolenic acid content of the oil (%) for Canola, No. 1 Canada
-
Details
Figure 14b Alpha-linolenic acid content of the oil (%) for Canola, No. 1 Canada Year α-linolenic acid content (%) 2000 9.9 2001 9.4 2002 10.6 2003 8.4 2004 11.2 2005 11.0 2006 9.9 2007 9.8 2008 9.1 2009 9.8 2010 10.4 2011 9.9 2012 9.6 2013 9.1 2014 9.2 2015 9.7 2016 9.6 2017 9.5 2018 8.7 2019 10.0 2020 8.9 2021 8.7
Figure 14c Oleic acid content of the oil (%) for Canola, No. 1 Canada
-
Details
Figure 14c Oleic acid content of the oil (%) for Canola, No. 1 Canada Year Oleic acid content (%) 2000 61.5 2001 61.9 2002 60.6 2003 63.2 2004 58.9 2005 59.8 2006 62.1 2007 61.5 2008 63.2 2009 62.3 2010 62.3 2011 62.0 2012 62.5 2013 63.4 2014 62.9 2015 62.6 2016 62.6 2017 63.0 2018 64.3 2019 62.4 2020 63.9 2021 64.2
Figure 14d Linoleic acid content of the oil (%) for Canola, No. 1 Canada
-
Details
Figure 14d Linoleic acid content of the oil (%) for Canola, No. 1 Canada Year Linoleic acid content (%) 2000 19.08 2001 19.12 2002 19.14 2003 18.52 2004 20.29 2005 19.70 2006 18.86 2007 19.30 2008 18.45 2009 18.81 2010 18.86 2011 19.05 2012 19.17 2013 19.52 2014 18.66 2015 18.78 2016 18.90 2017 18.85 2018 18.32 2019 18.74 2020 18.29 2021 18.32
Figure 14e Saturated fatty acid content of the oil (%) for Canola, No. 1 Canada
-
Details
Figure 14e Saturated fatty acid content of the oil (%) for Canola, No. 1 Canada Year Saturated fatty acid content (%) 2000 7.09 2001 7.20 2002 7.03 2003 7.26 2004 6.96 2005 6.96 2006 6.98 2007 6.98 2008 7.09 2009 6.85 2010 6.85 2011 6.80 2012 6.58 2013 6.80 2014 6.74 2015 6.65 2016 6.74 2017 6.53 2018 6.67 2019 6.60 2020 6.80 2021 6.58
Figure 14f Iodine value of the oil (units) for Canola, No. 1 Canada
-
Details
Figure 14f Iodine value of the oil (units) for Canola, No. 1 Canada Year Iodine value (units) 2000 114.0 2001 112.4 2002 114.7 2003 110.1 2004 117.0 2005 116.0 2006 113.4 2007 113.3 2008 111.5 2009 114.0 2010 115.0 2011 113.6 2012 113.3 2013 111.8 2014 112.2 2015 113.1 2016 113.1 2017 113.1 2018 111.0 2019 113.7 2020 111.3 2021 110.9
"Page details"
- Date modified: