Quality of western Canadian canola 2021
Glucosinolate content
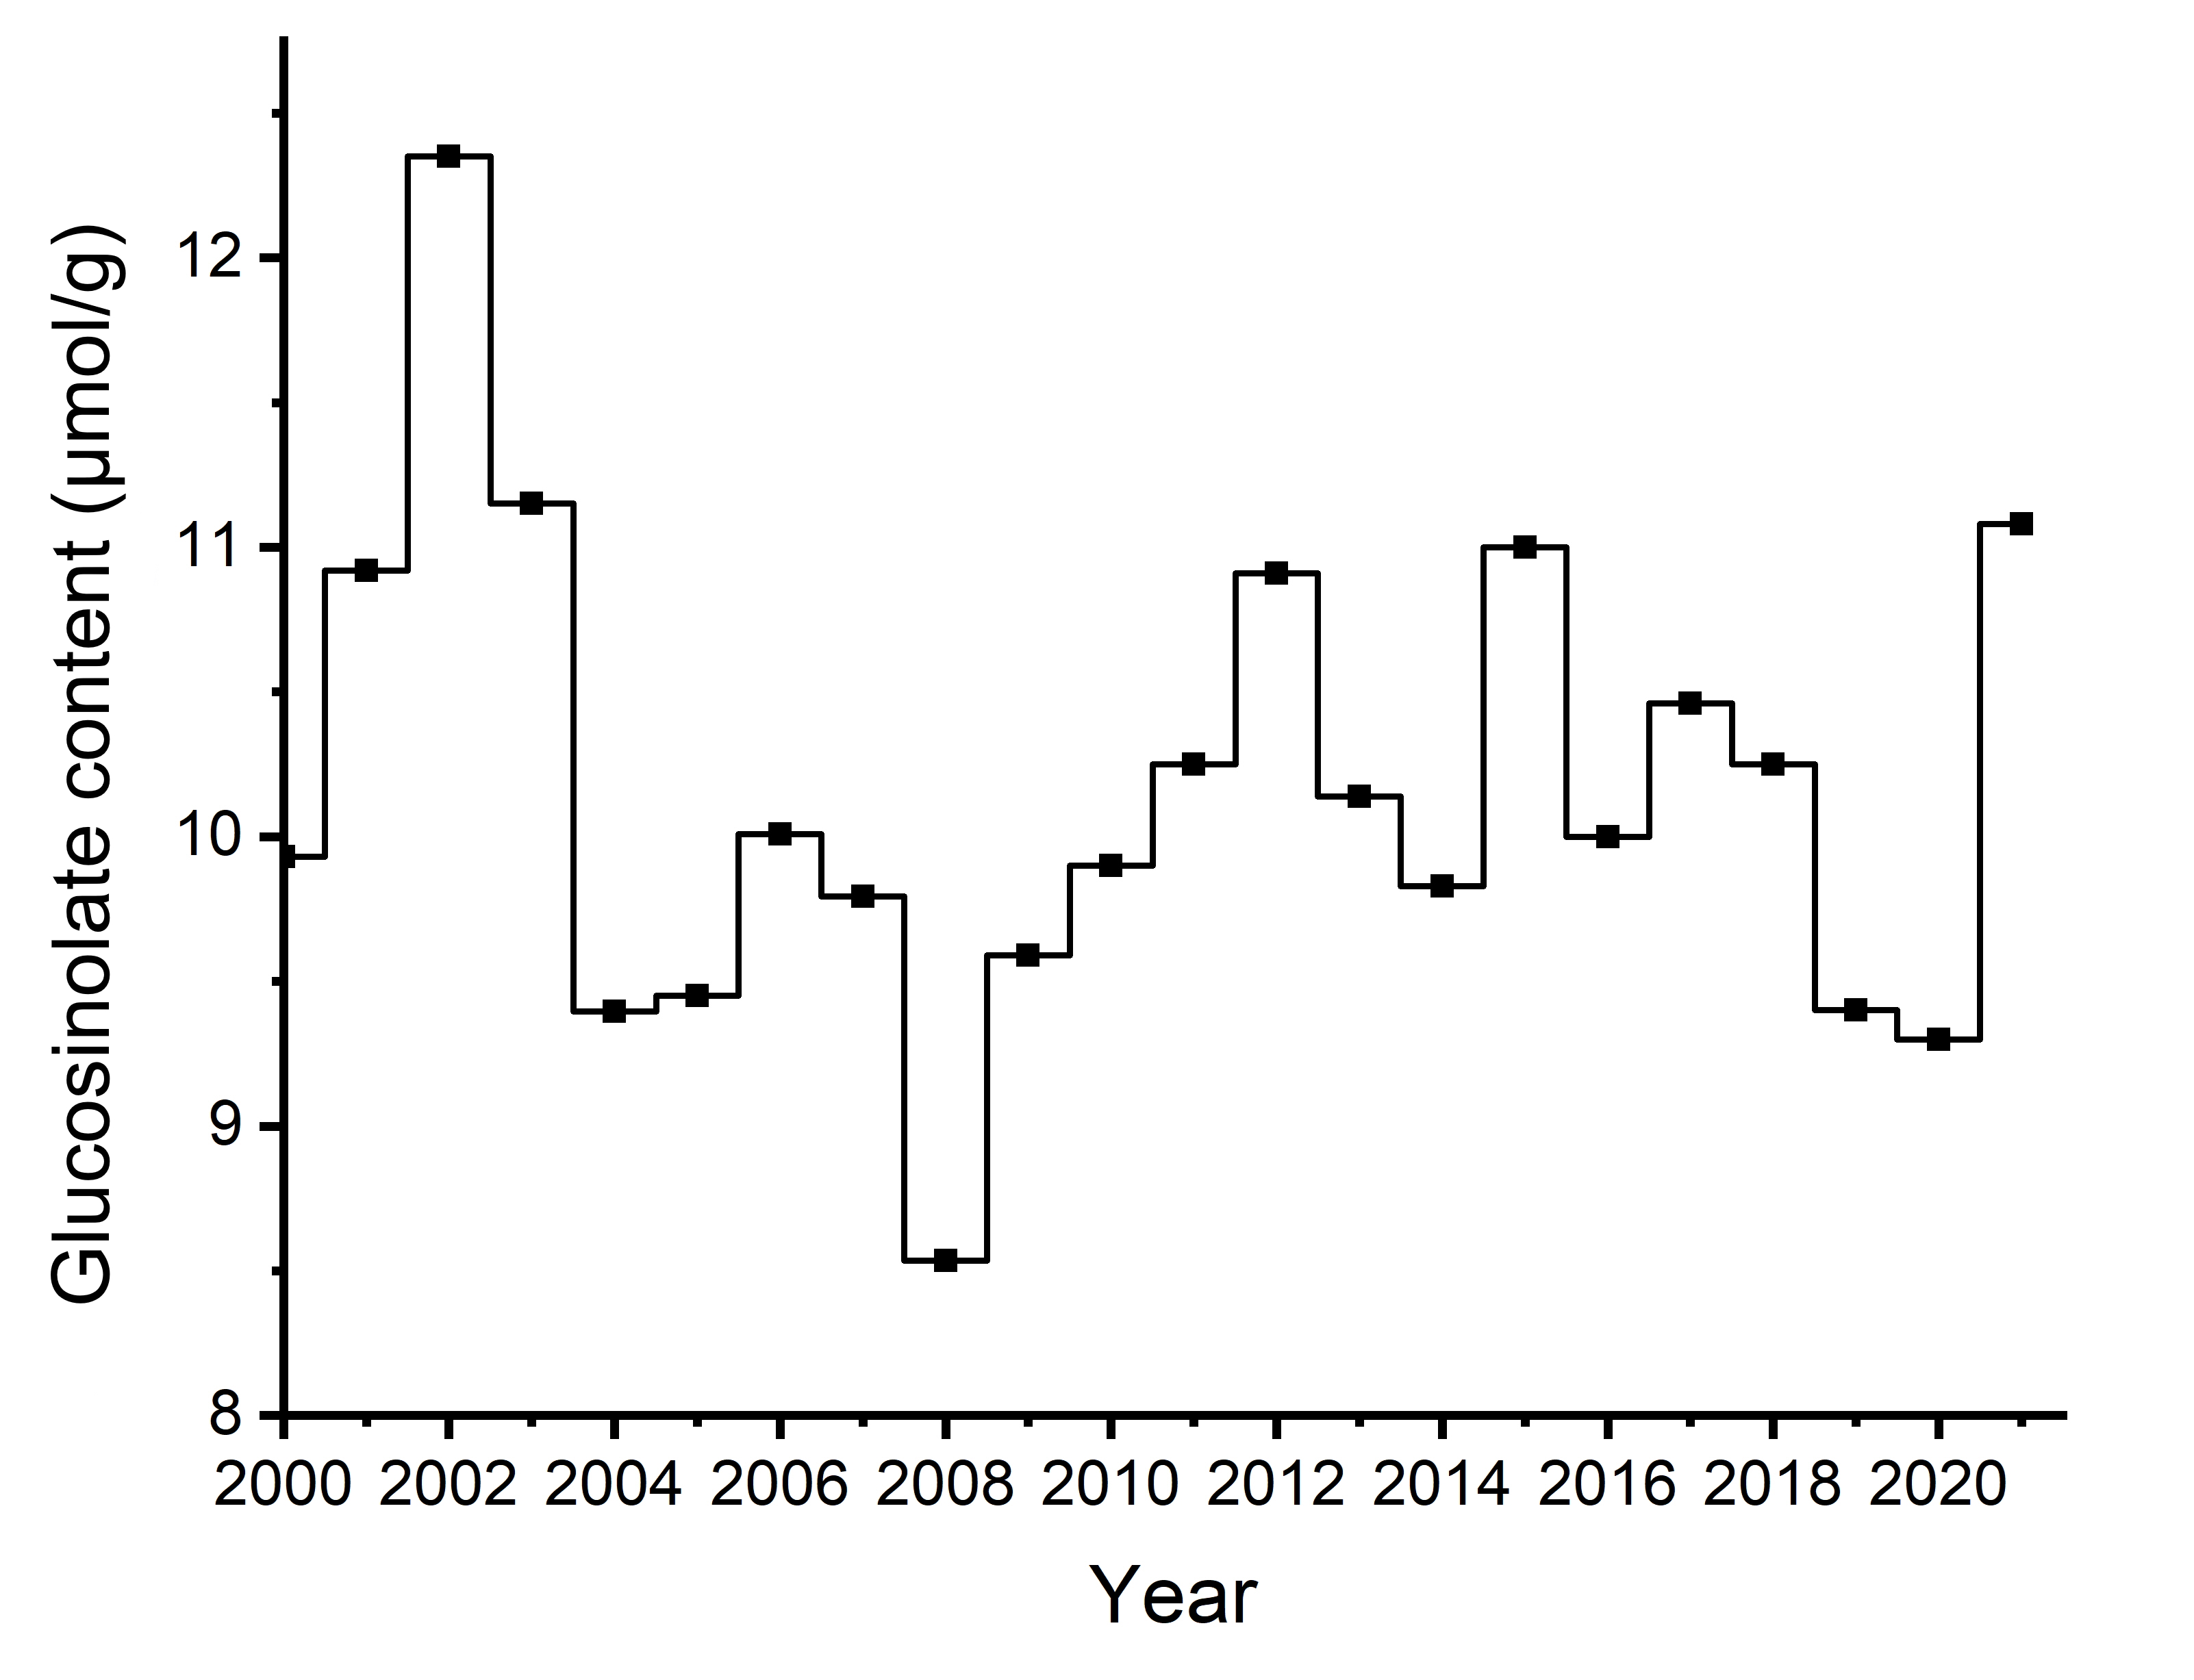
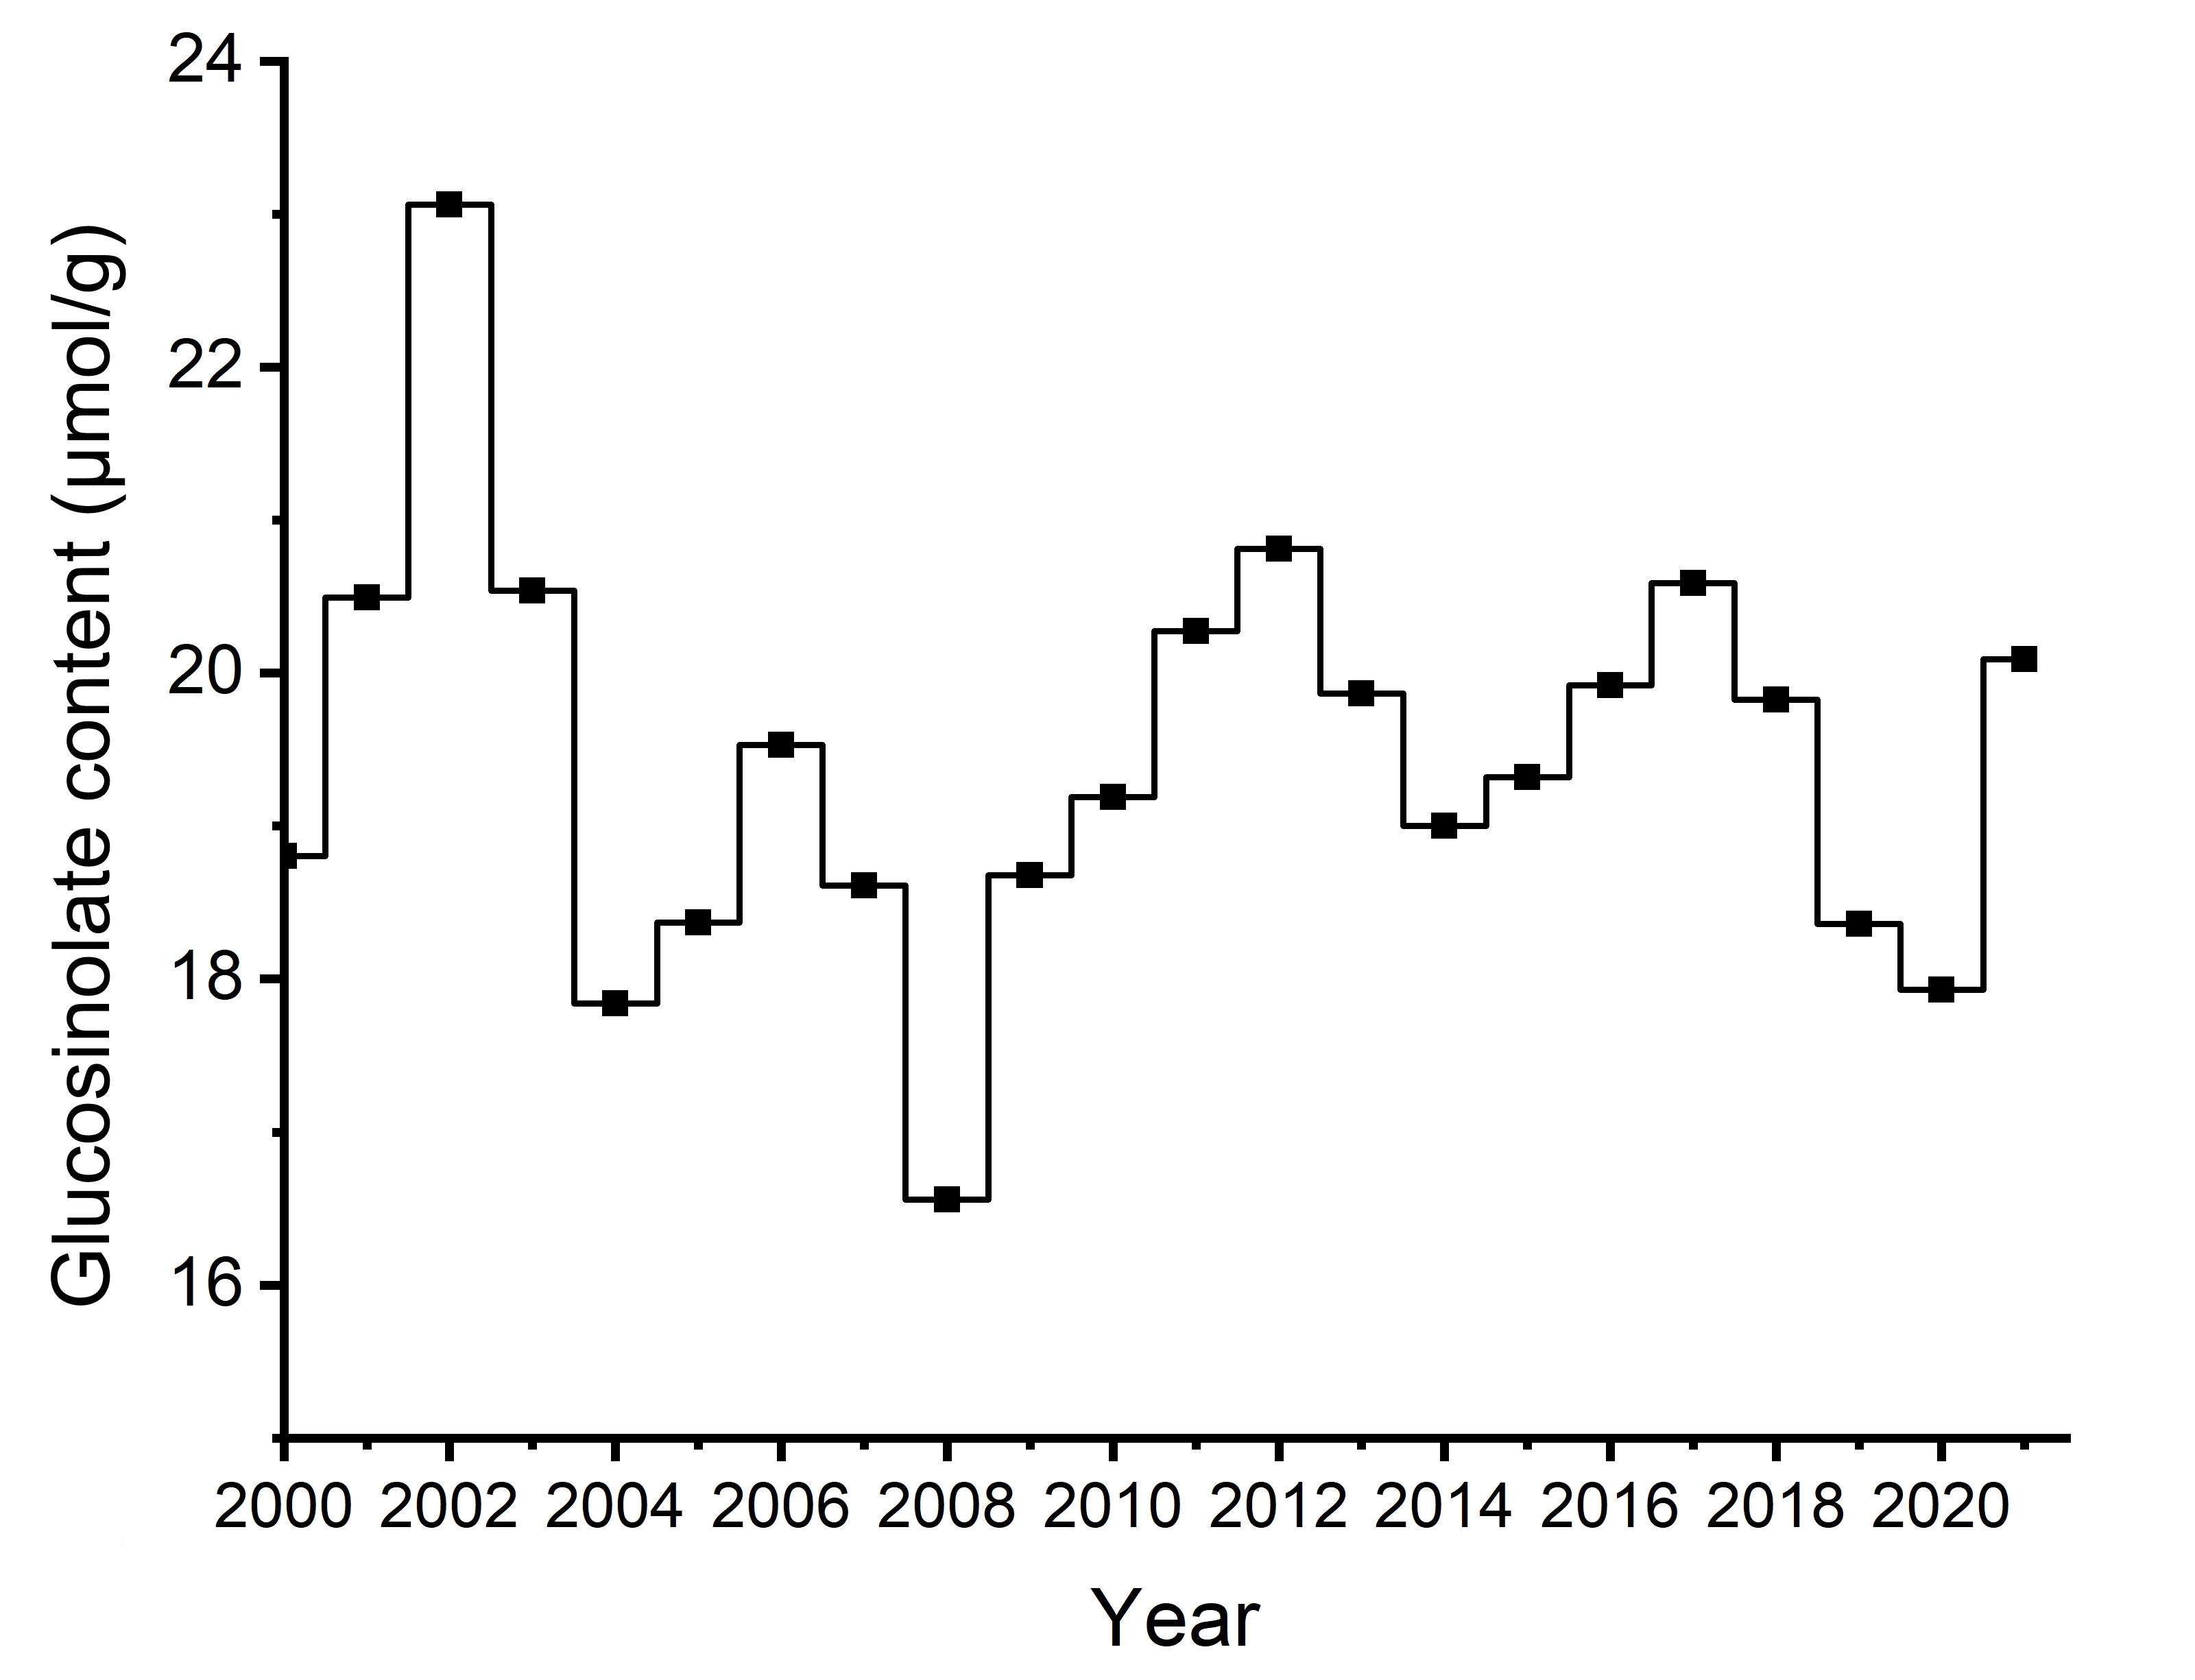
The averages of total glucosinolate content of canola seeds at 8.5% moisture and the averages of calculated total glucosinolate content of canola meal (after oil removal) at 8.5% moisture from 2000 to 2021 are presented in Figure 12a and Figure 12b, respectively.
In 2021, Canola, No. 1 Canada seeds (Table 2) had an average glucosinolate content of 11 micromoles per gram (μmol/g), higher than the 2020 average of 10 μmol/g but identical to the 5-year average of 11 μmol/g. This is the highest average glucosinolate content since 2015 (Figure 12a). There was no significant difference in total glucosinolate content between various crop districts or provinces.
The December 2021 and the August to November 2021 CC canola exports had an average level of total seed glucosinolates of 12 μmol/g of seed which is slightly higher than the level in last year’s shipping season samples (10 μmol/g; Table 4).
In 2021, 11 μmol/g of total glucosinolates in seed corresponded to 20 μmol/g in oil-free meal on an 8.5% moisture basis. This is slightly higher than both the 5-year average (19 μmol/g, 8.5% moisture basis) and the 2020 harvest average (18 μmol/g, 8.5% moisture basis) (Figure 12b and Table 1). The total glucosinolates in Canadian canola meal obtained from conventional crushing plants (expeller press followed by solvent extraction) is much lower than this calculated value. The calculated values assume that 100% of the oil is recovered from the seed during crushing and that no glucosinolates are destroyed during processing, which is never the case.
Research done in Australia showed that for canola, the total glucosinolate content for a given variety can be affected by environmental conditions. It was found that hot and dry conditions post flowering led to an increase in glucosinolate content in the seeds. In 2021, heat and lack of moisture were prevalent in western Canada. The severe growing conditions are likely responsible for the increase in total glucosinolates observed this year.
Figure 12a Total glucosinolate content of seed (μmol/g, 8.5% moisture) for Canola, No. 1 Canada

-
Details
Figure 12a Total glucosinolate content of seed (μmol/g, 8.5% moisture) for Canola, No. 1 Canada Year Glucosinolate content (µmoles/g) 2000 9.9 2001 10.9 2002 12.4 2003 11.2 2004 9.4 2005 9.5 2006 10.0 2007 9.8 2008 8.5 2009 9.6 2010 9.9 2011 10.3 2012 10.9 2013 10.1 2014 9.8 2015 10.9 2016 10.3 2017 10.5 2018 10.3 2019 9.0 2020 9.0 2021 11.1
Figure 12b Total glucosinolate content of meal (μmol/g oil-free, 8.5% moisture) for Canola, No. 1 Canada

-
Details
Figure 12b Total glucosinolate content of meal (μmol/g oil-free, 8.5% moisture) for Canola, No. 1 Canada Year Glucosinolate content (µmol/g) 2000 18.8 2001 20.5 2002 23.1 2003 20.5 2004 17.8 2005 18.4 2006 19.5 2007 18.6 2008 16.6 2009 18.7 2010 19.2 2011 20.3 2012 20.8 2013 19.9 2014 19.0 2015 21.1 2016 19.9 2017 20.6 2018 19.8 2019 18.0 2020 18.0 2021 20.1
"Page details"
- Date modified: